

IMPORTANT UPDATE:
It has come to my attention that there is some double-counting within the methods described below due to the construction of the sourced datasets. I’m investigating further to determine how big an effect the double-counting has. Right now, it looks like it could be about a 50% reduction in the flow estimated in the US case. That would be a sizeable reduction in the headline number, but it wouldn’t change the identification of bank money creation as a very big monetary flow (54% of GDP rather than 108% of GDP).
I’m leaving this article up while I (find the time to) work through the data myself because the article’s main arguments are only reinforced by the data difficulties. Those arguments are that (1) we should have access to reliable data on bank money creation because (2) there is evidence that bank money creation strongly influences our economies in ways that can only be properly understood with that data.
If you’ve never thought of bank money creation as one of the most powerful forces shaping the economy, you are not alone. It didn’t strike me as particularly important when I learned about it in my college macroeconomics class. I now know my experience is common. Mainstream economics education places little emphasis on bank money creation. For example, the globally best-selling economics textbook of the last 30 years leaves the topic of bank money creation to chapter 29 and presents it alongside the idea of monetary neutrality, which is “the proposition that changes in the money supply do not affect real variables.”
This article provides entry points into the body of research that shows modern economies are profoundly shaped by bank money creation. For example, changes in bank money creation predict (and explain) the growth and decline of economies better than other factors economists and policymakers typically rely on.
We’ll proceed in a four step process:
Debunking the story that banks lend out depositors’ savings,
Seeing what economic models show when they reflect how banks really work,
Uncovering the massive scale of banks’ money creation,
Considering the consequences of the decision-making power that so much money creation confers on banks.
Debunking the story that banks lend out depositors’ savings
When I first learned about bank money creation, I learned the erroneous “fractional reserve” or “money multiplier” story. This story says that banks lend out a fraction of the deposits they receive. For example, banks are said to take in $100 dollars in deposits from a saver, set aside $10 in reserve, and lend out the other $90 to a borrower. This is said to expand the money supply because the bank continues to tell the saver that their money is in the bank, even though it has actually been lent out. As the story goes, this works as long as all savers don’t come to withdraw their money at the same time and the bank holds enough reserves to pay out withdrawals that savers want to make.
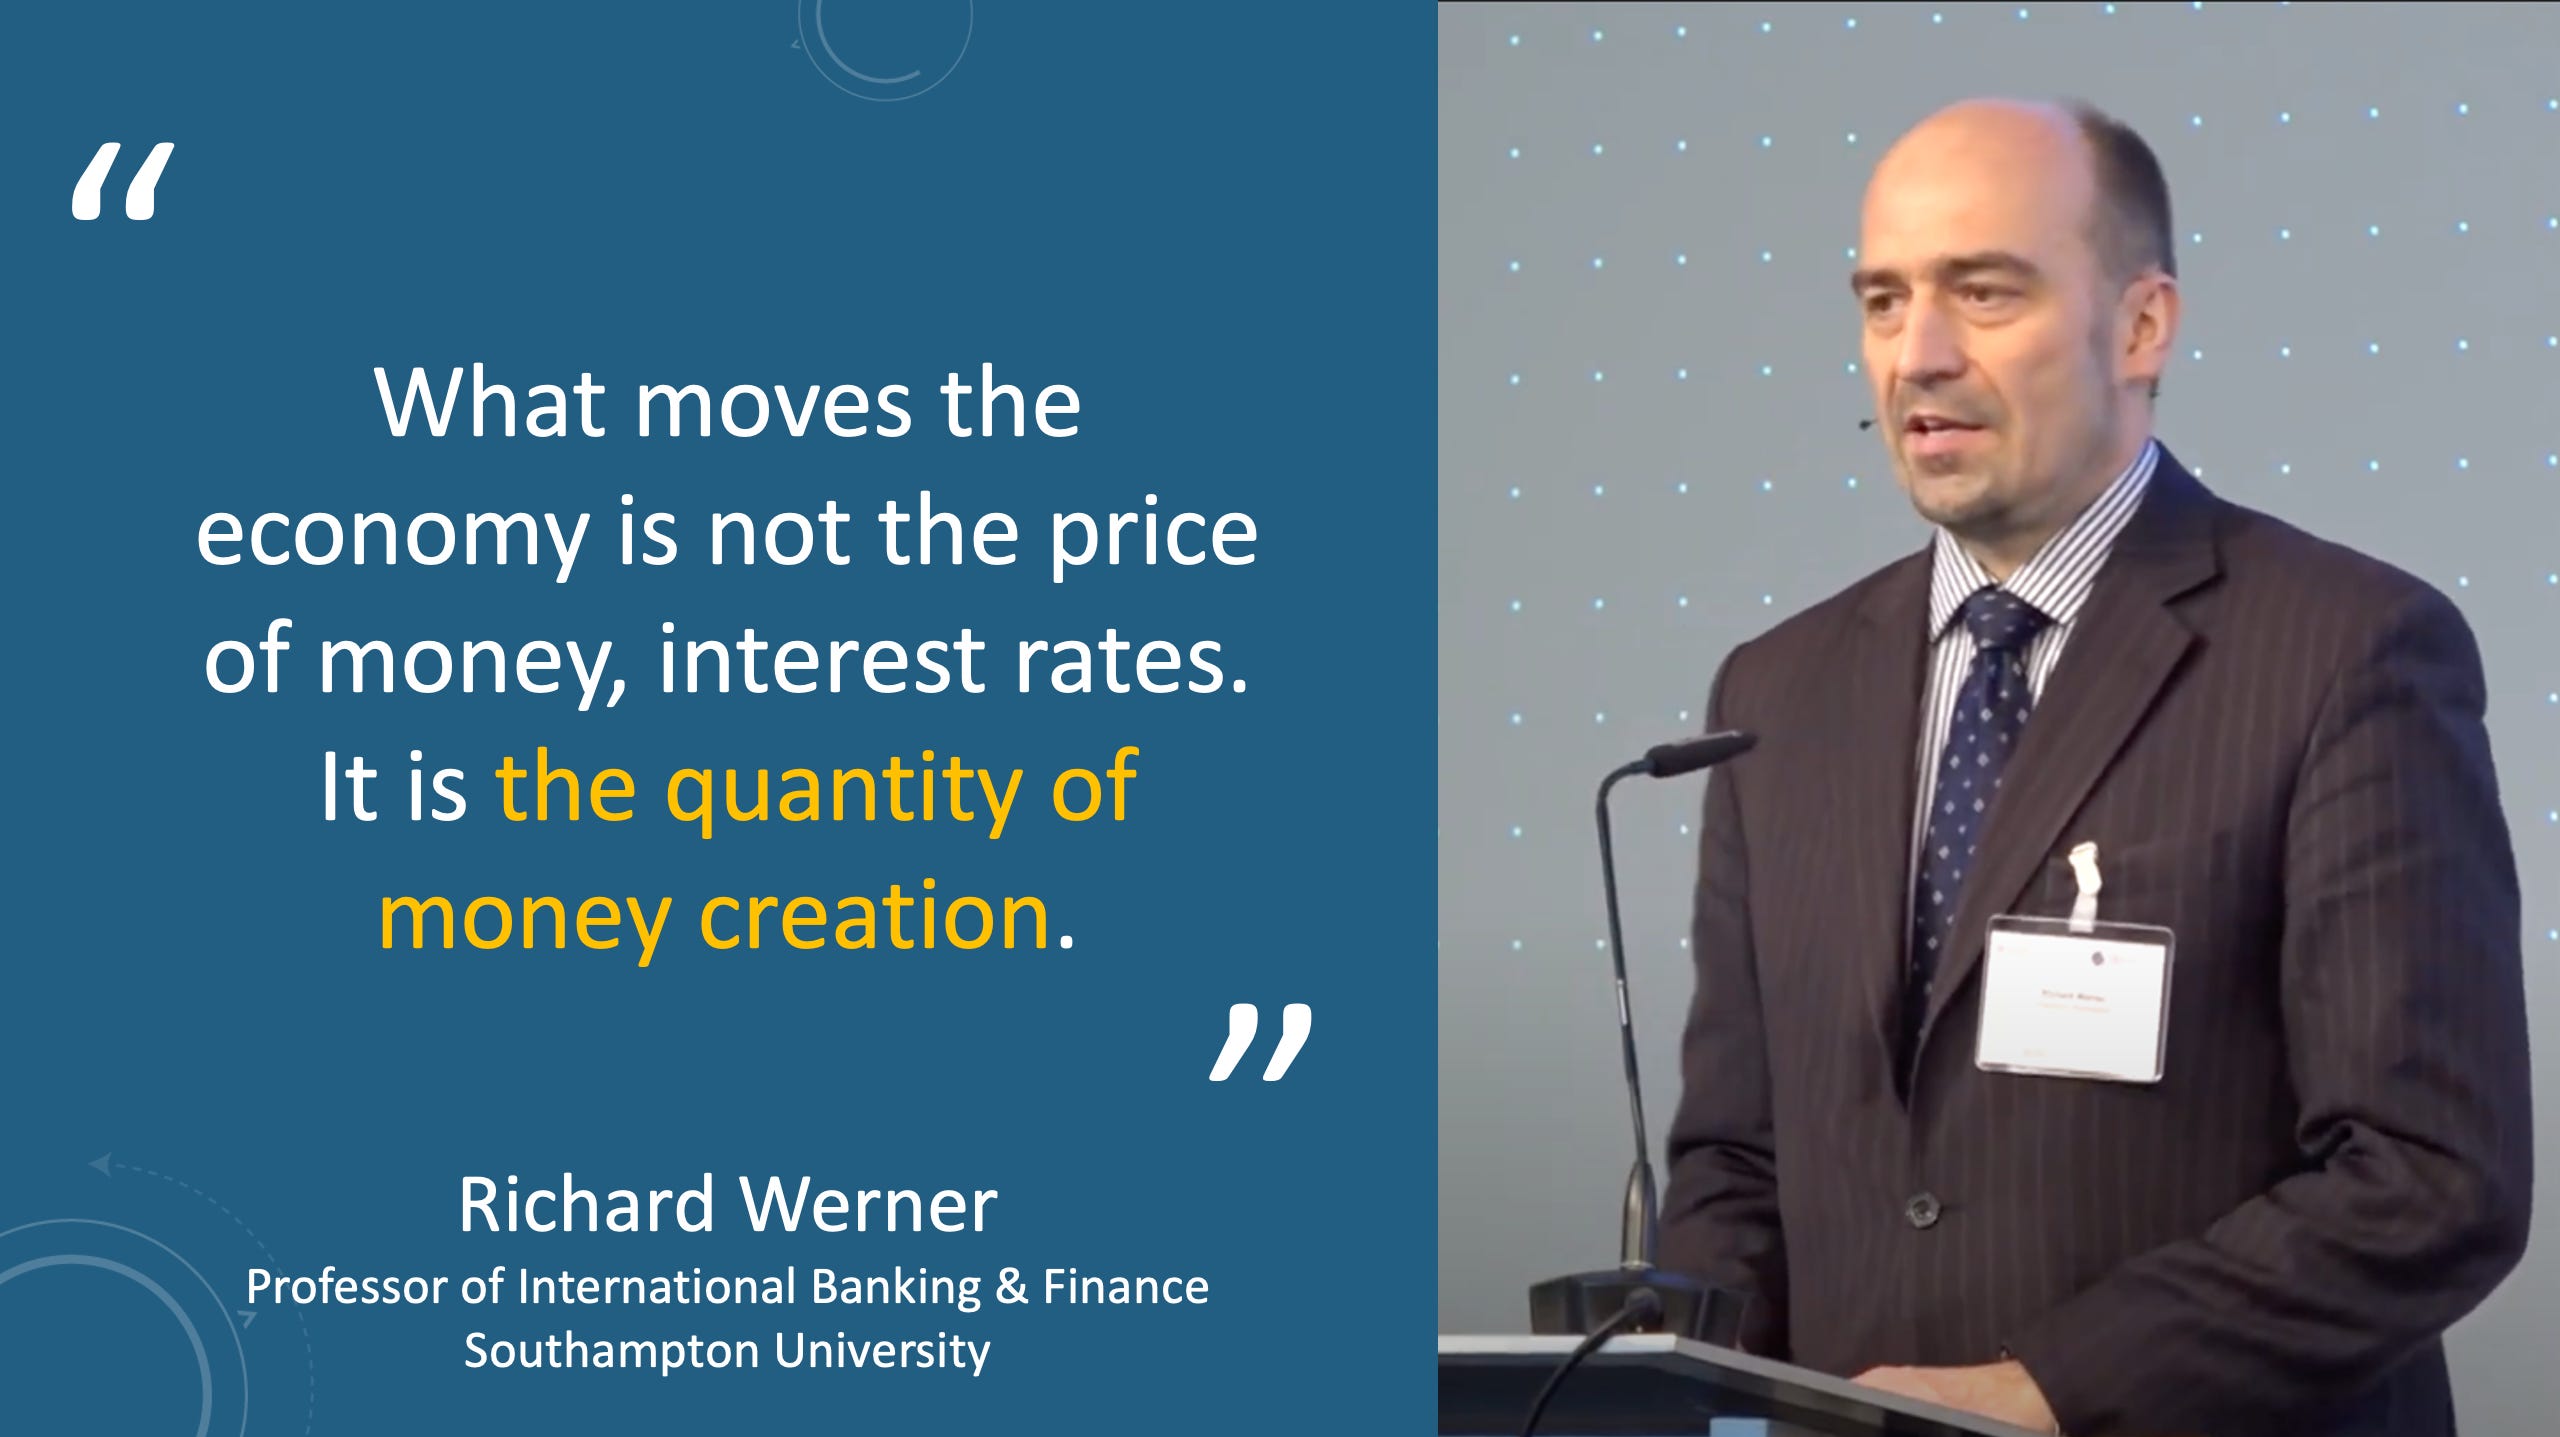
My mind was blown in 2020 when I learned from the Bank of England’s seminal bulletin, Money Creation in the Modern Economy, that the textbook story is completely false. The Bank of England politely describes it as “not an accurate description of how money is created in reality.” In reality, banks newly create 100% of the deposits they lend.
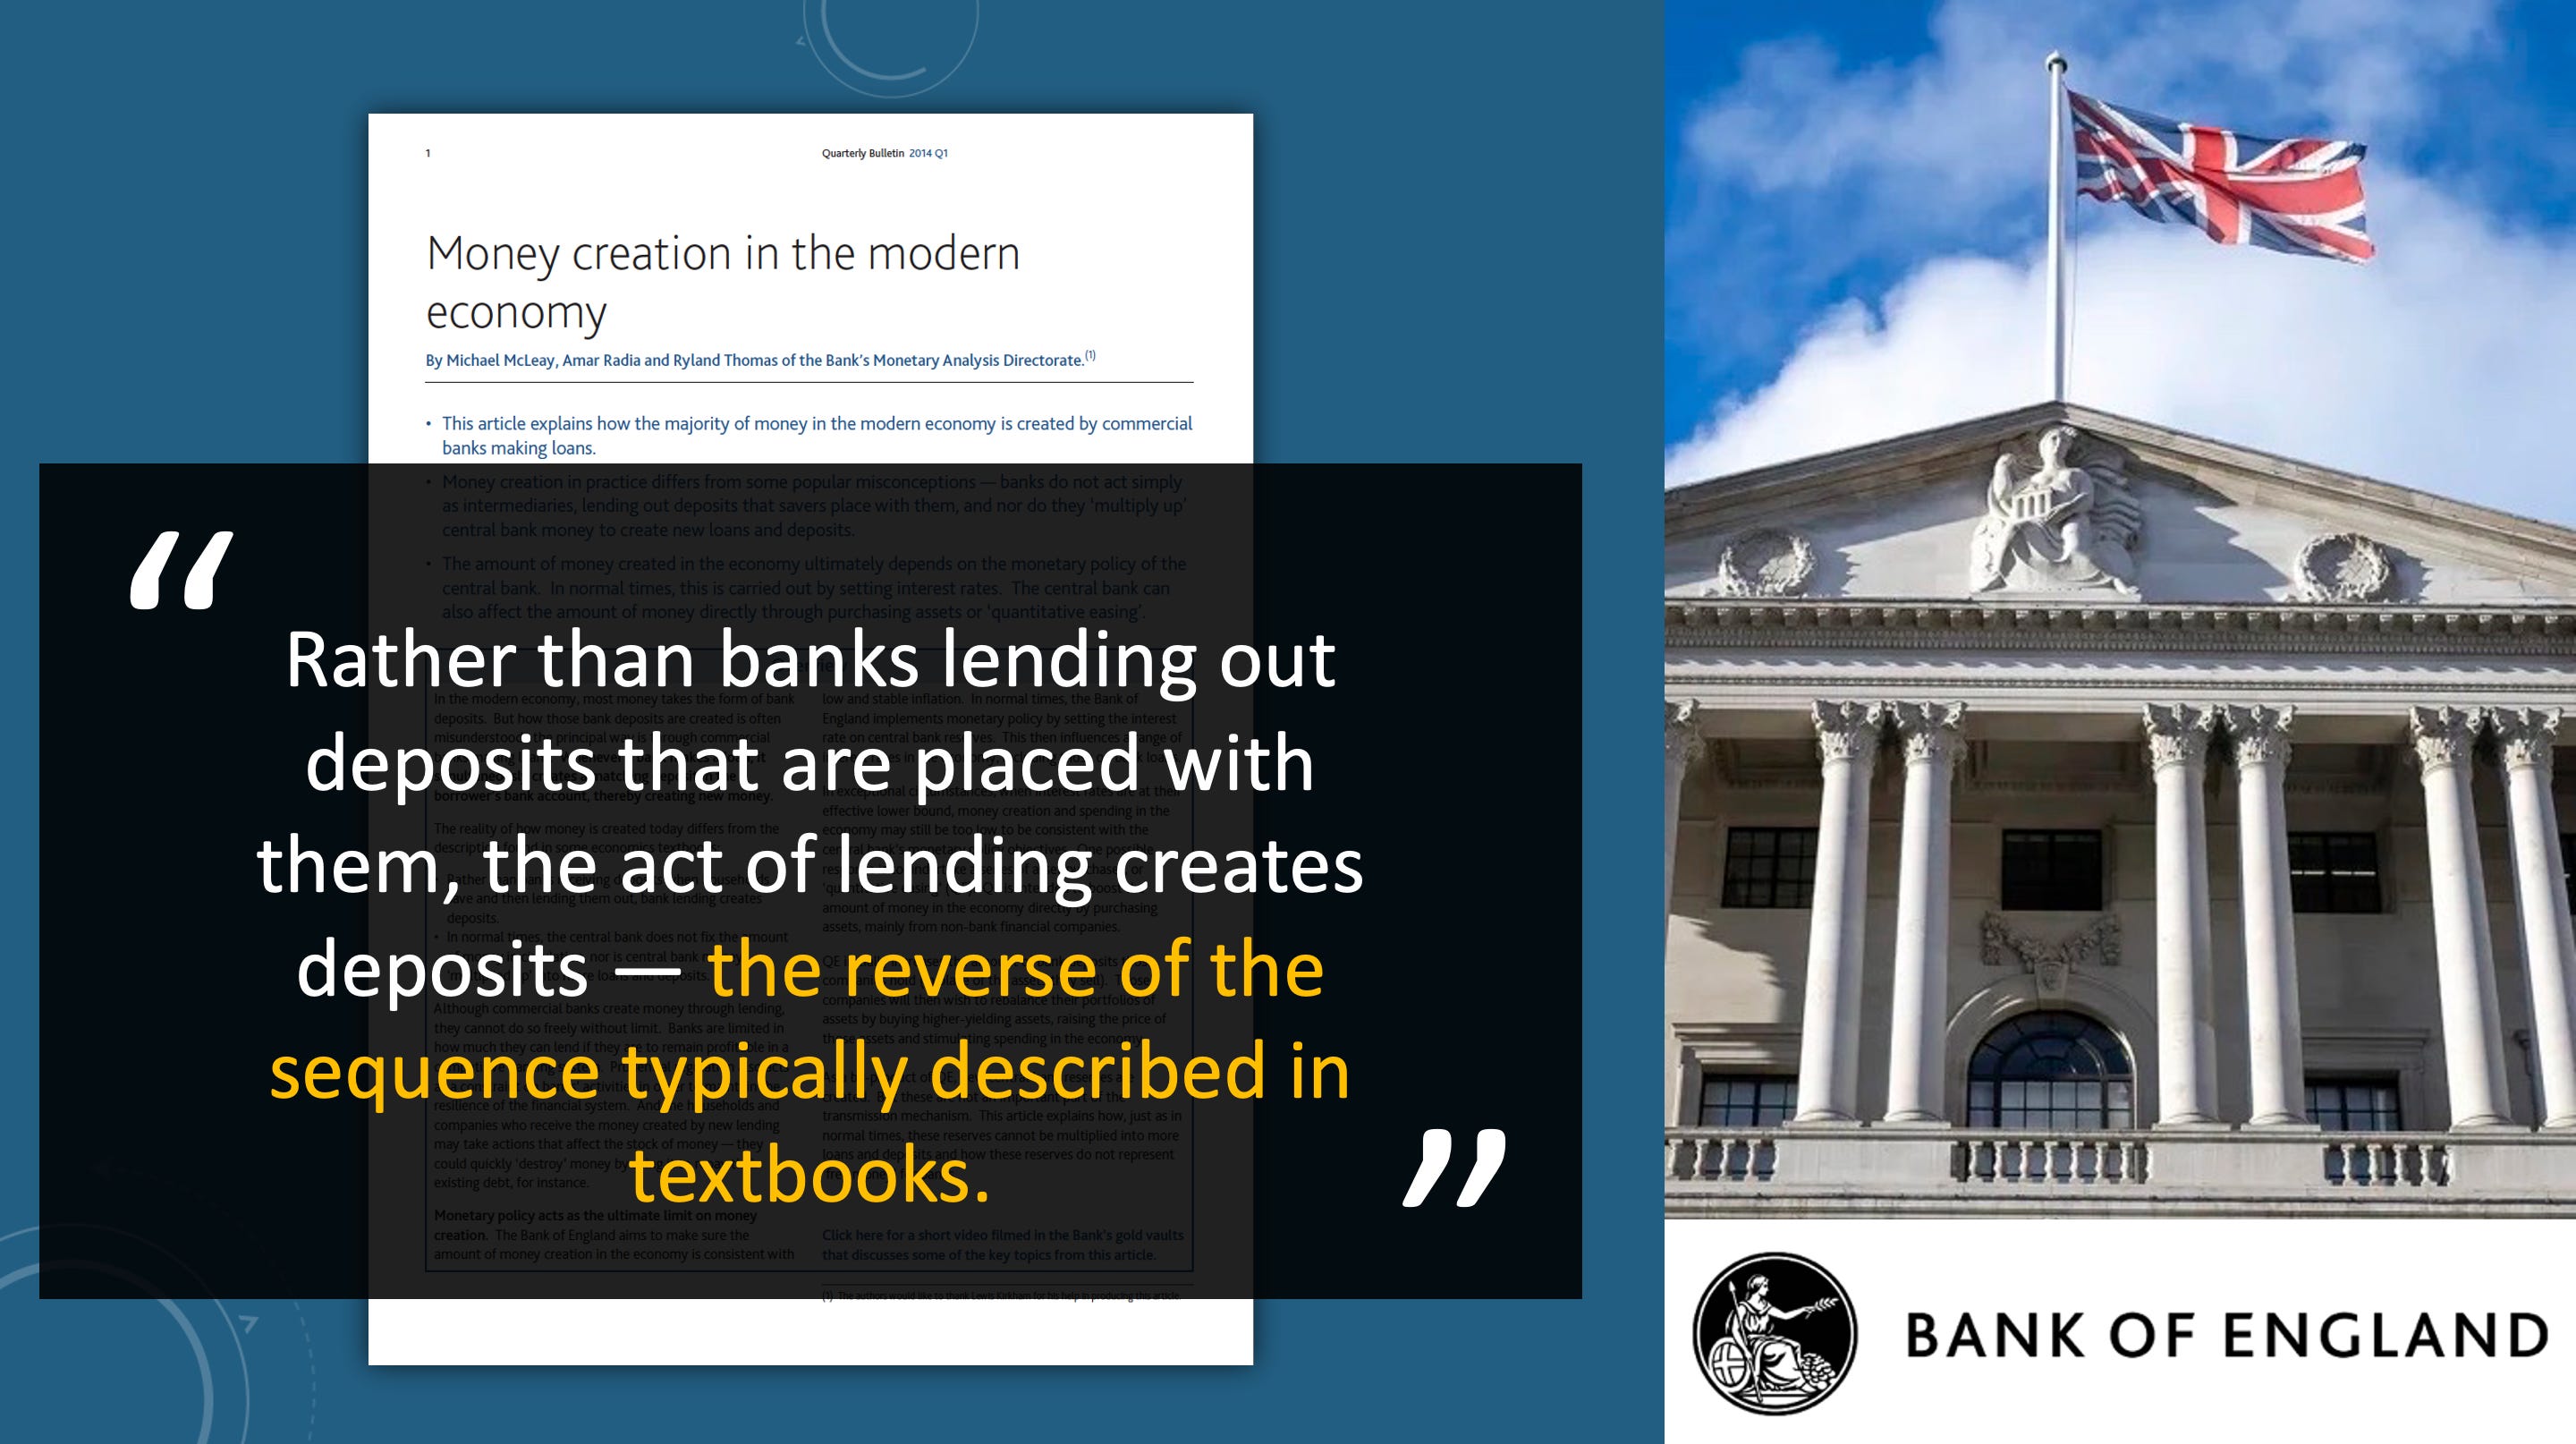
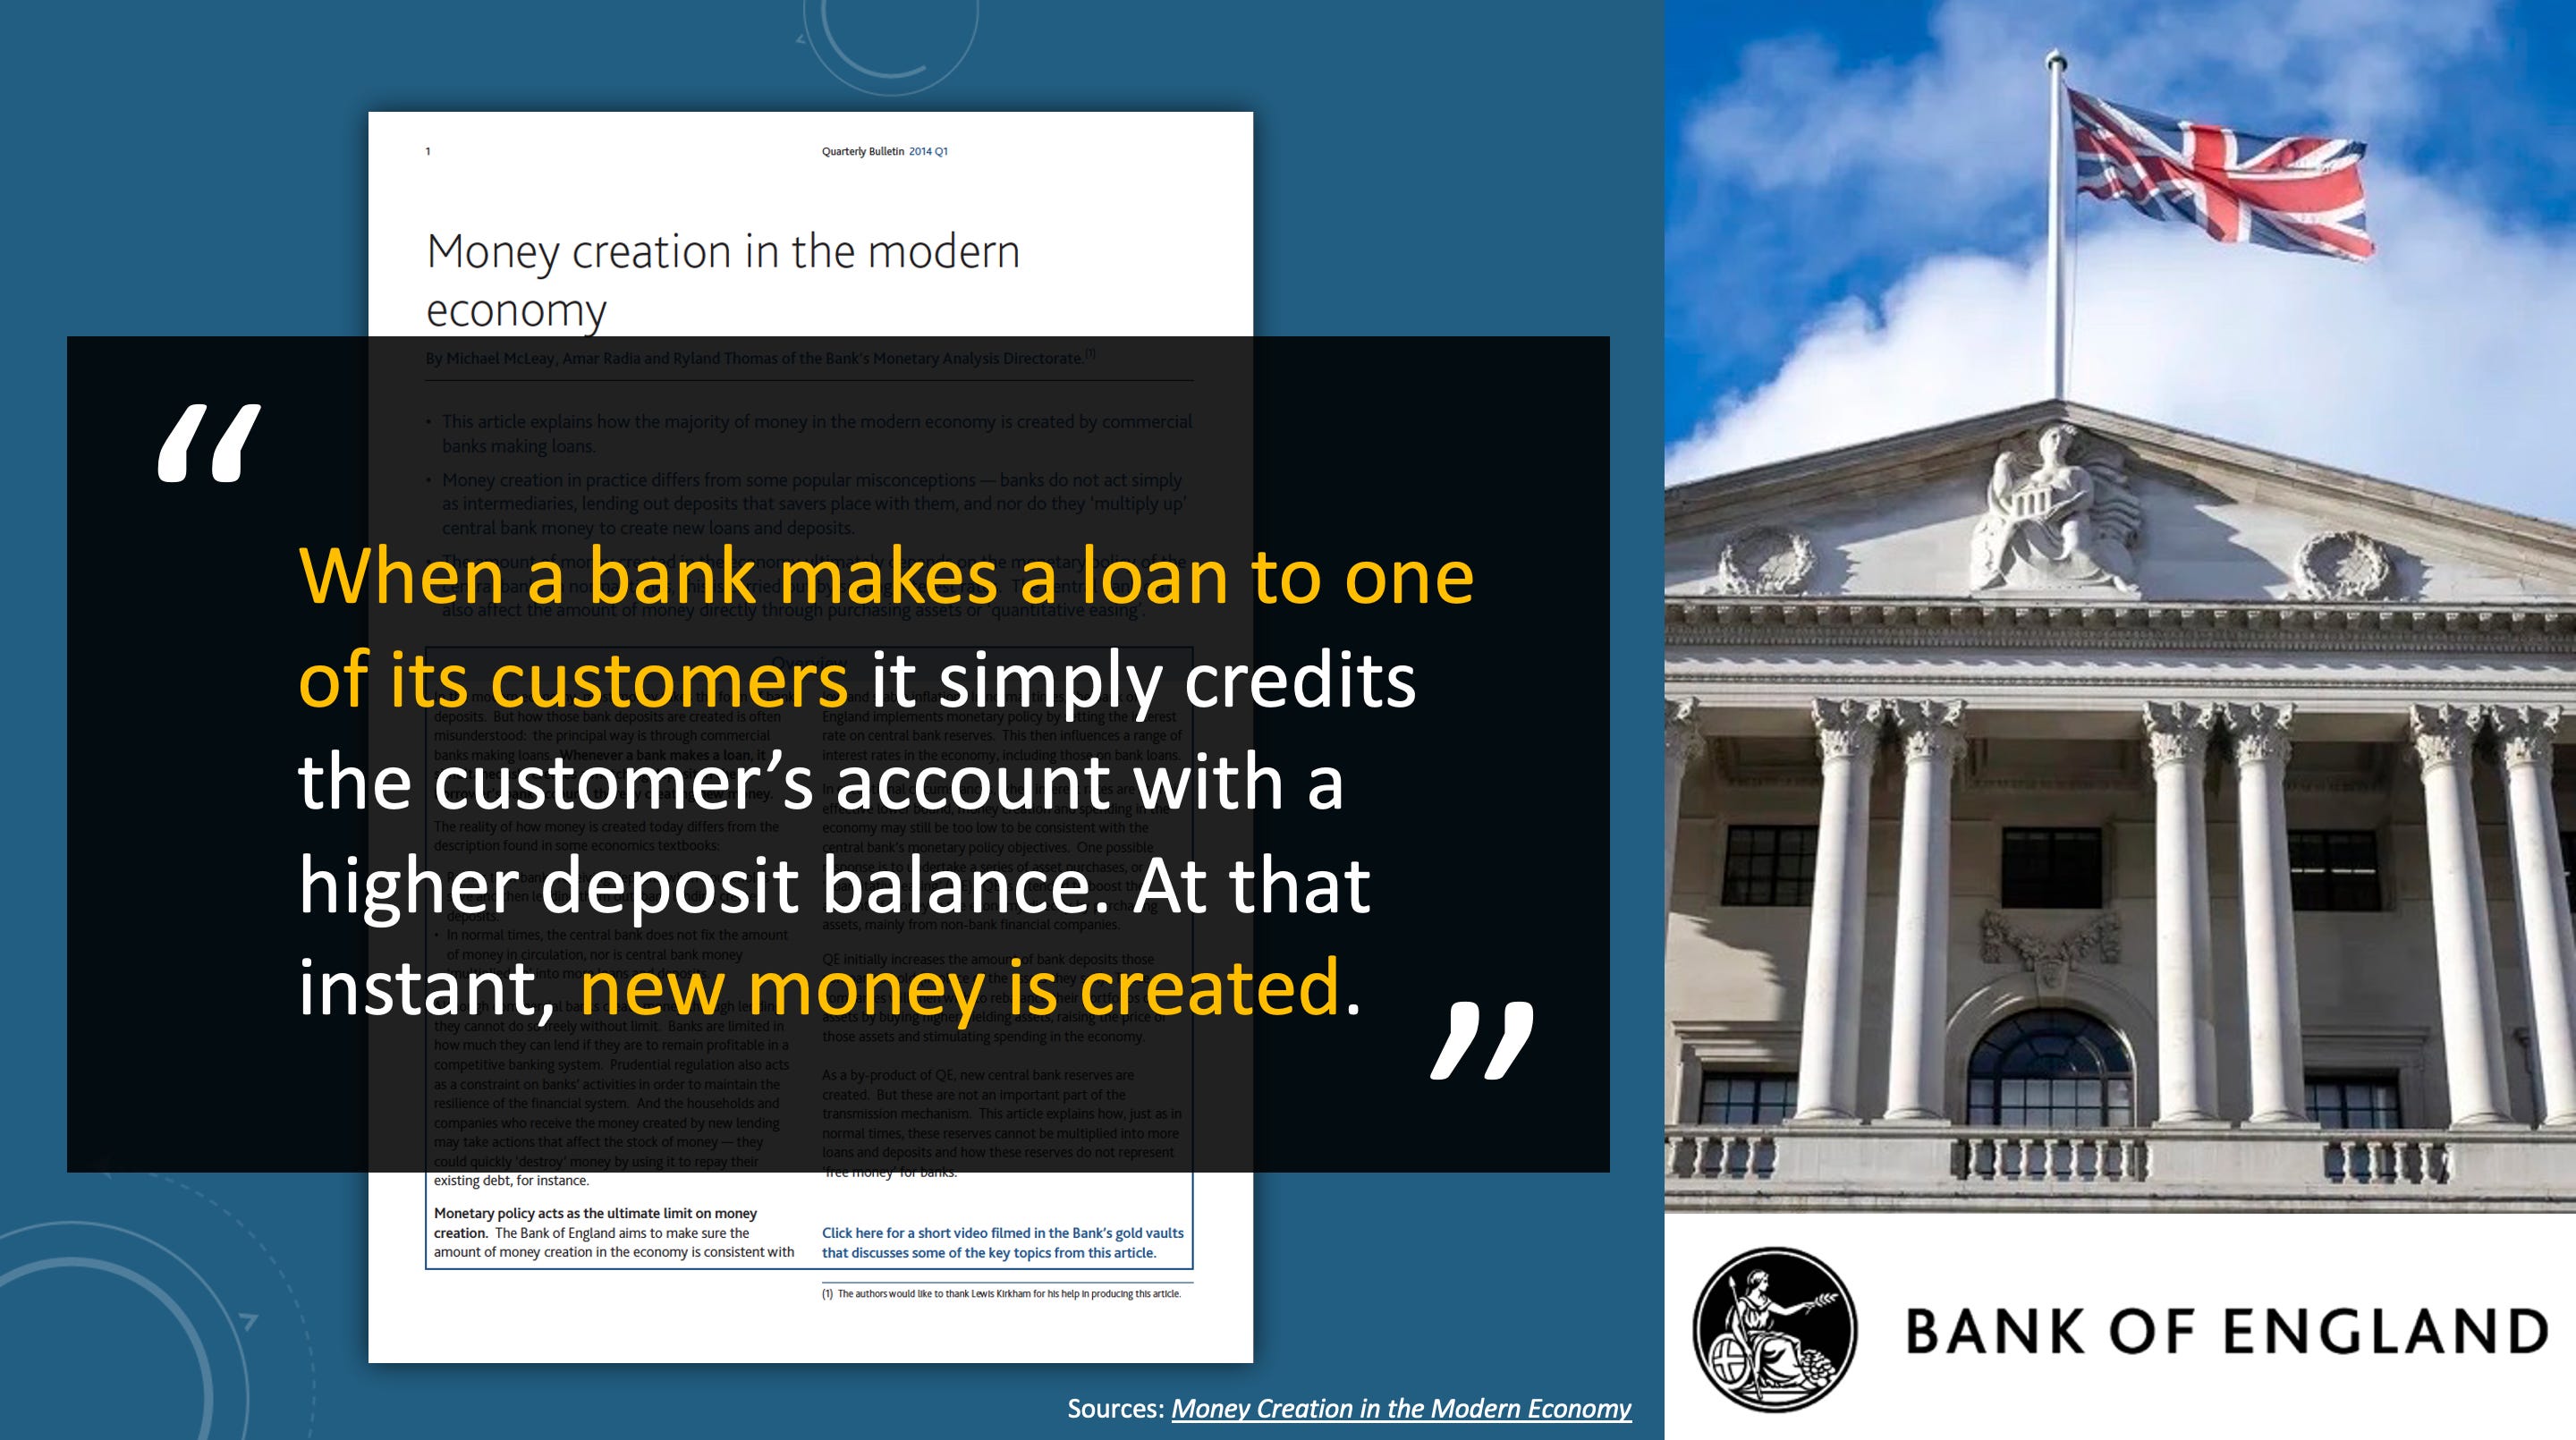
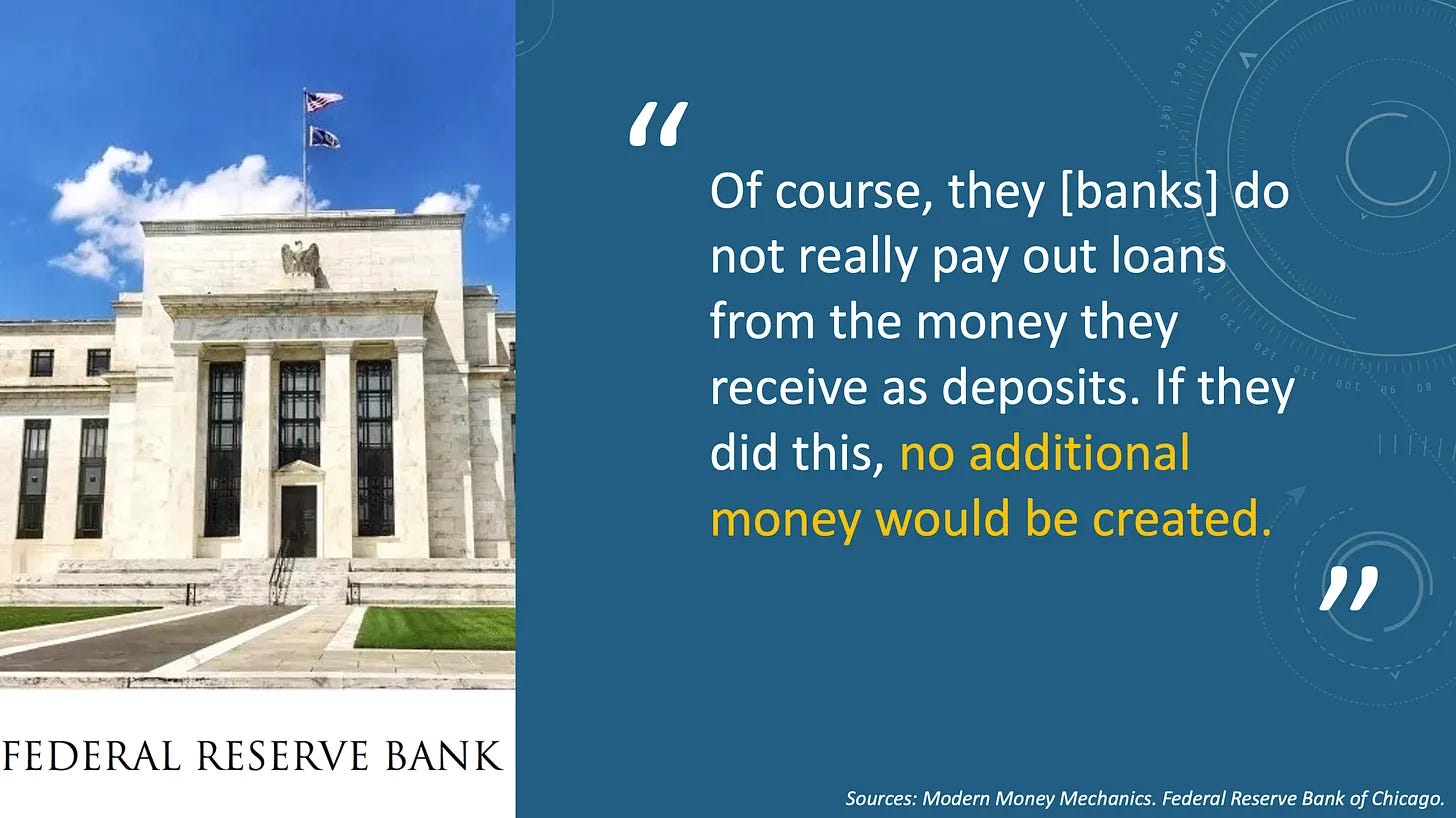
The Bank of England is not the only authoritative source saying this. Numerous other central banks, banks, and banking scholars have pointed out the same error in mainstream economic thinking.

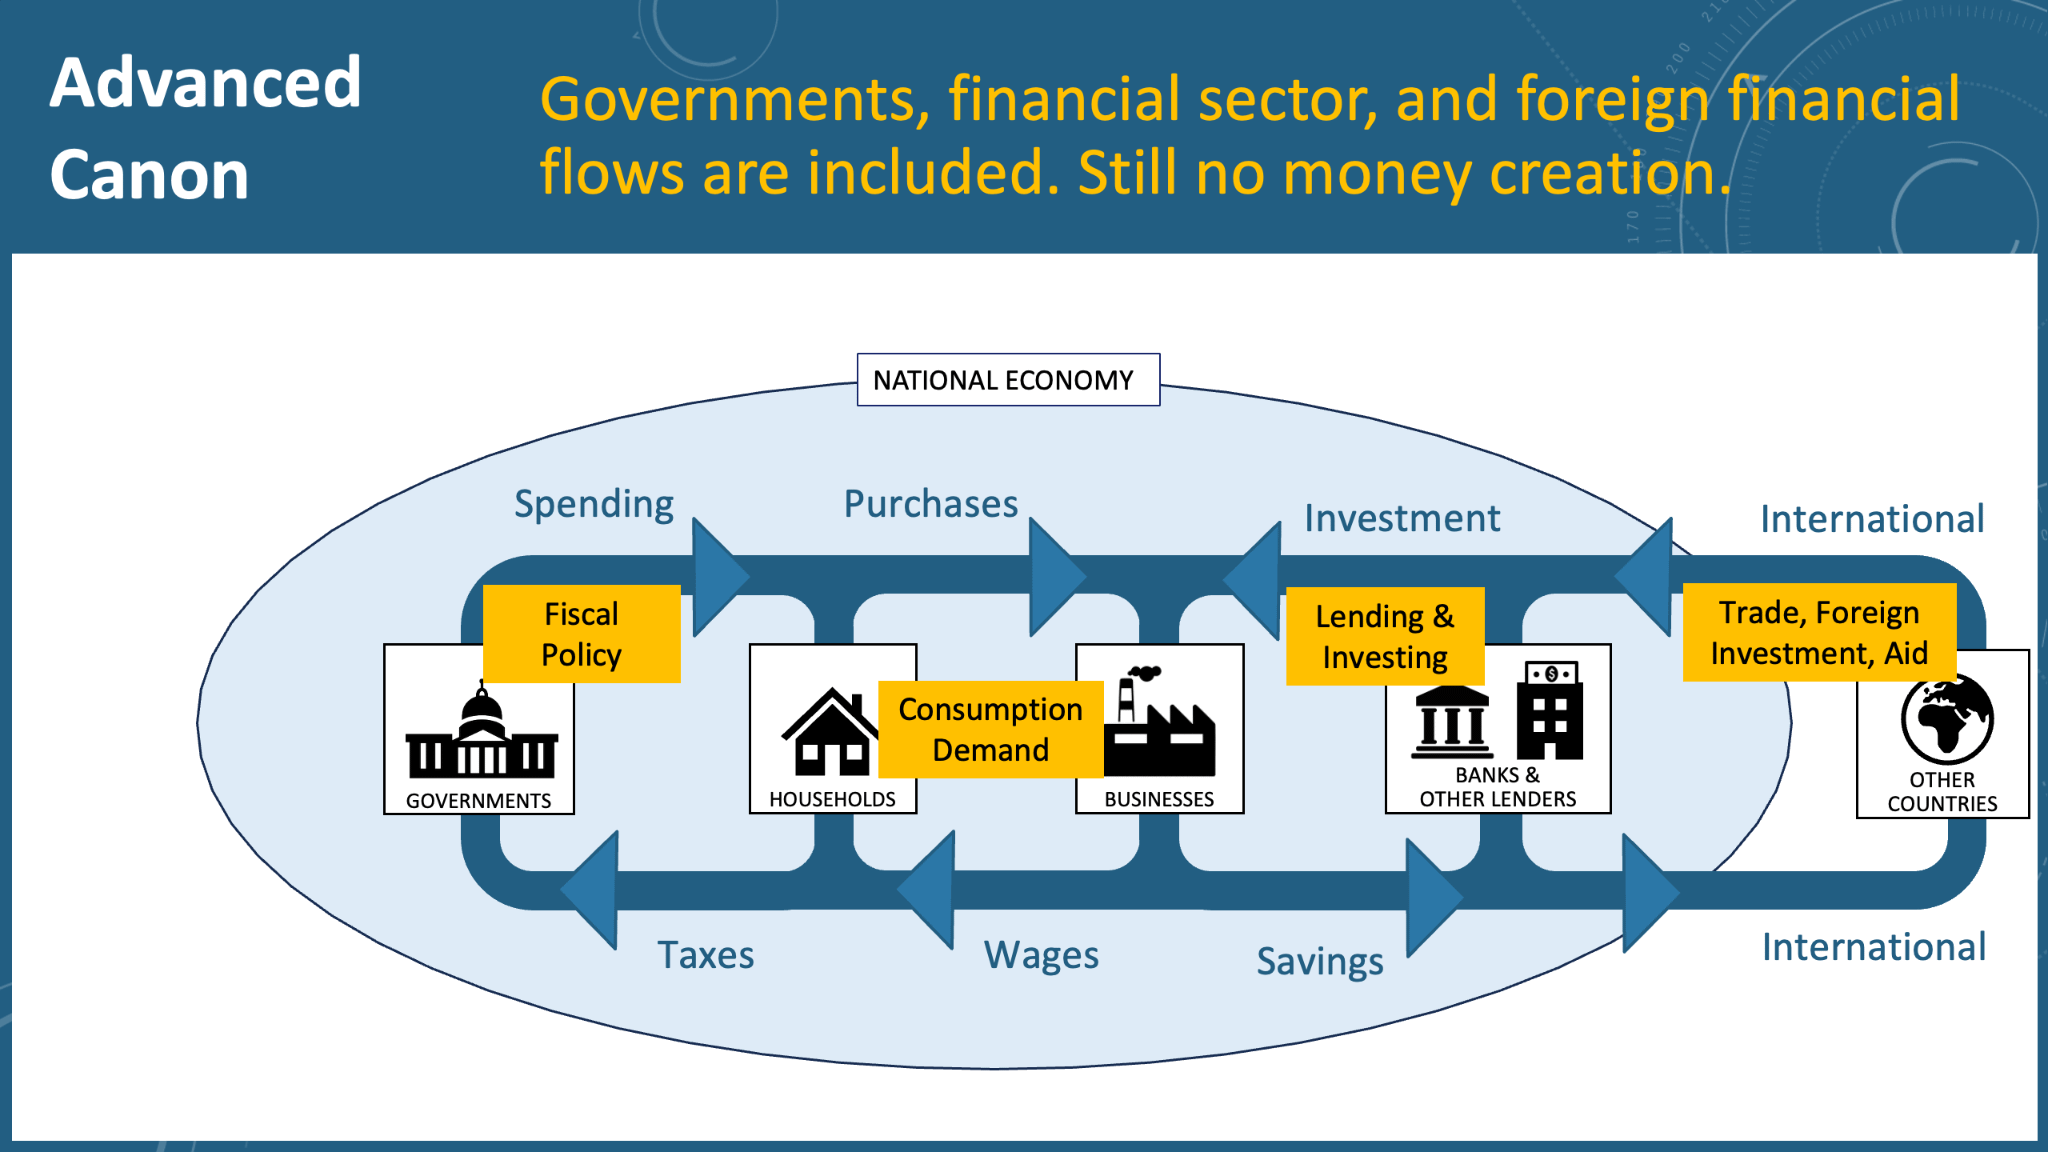
What this means is that the picture of the economy presented in mainstream textbooks is missing a critical financial flow: bank money creation. Here is the “circular flow” picture found in most textbooks:
Here’s what it looks like when you simply add the fact that new money is being created every time a bank lending creates money and loan repayments delete it:
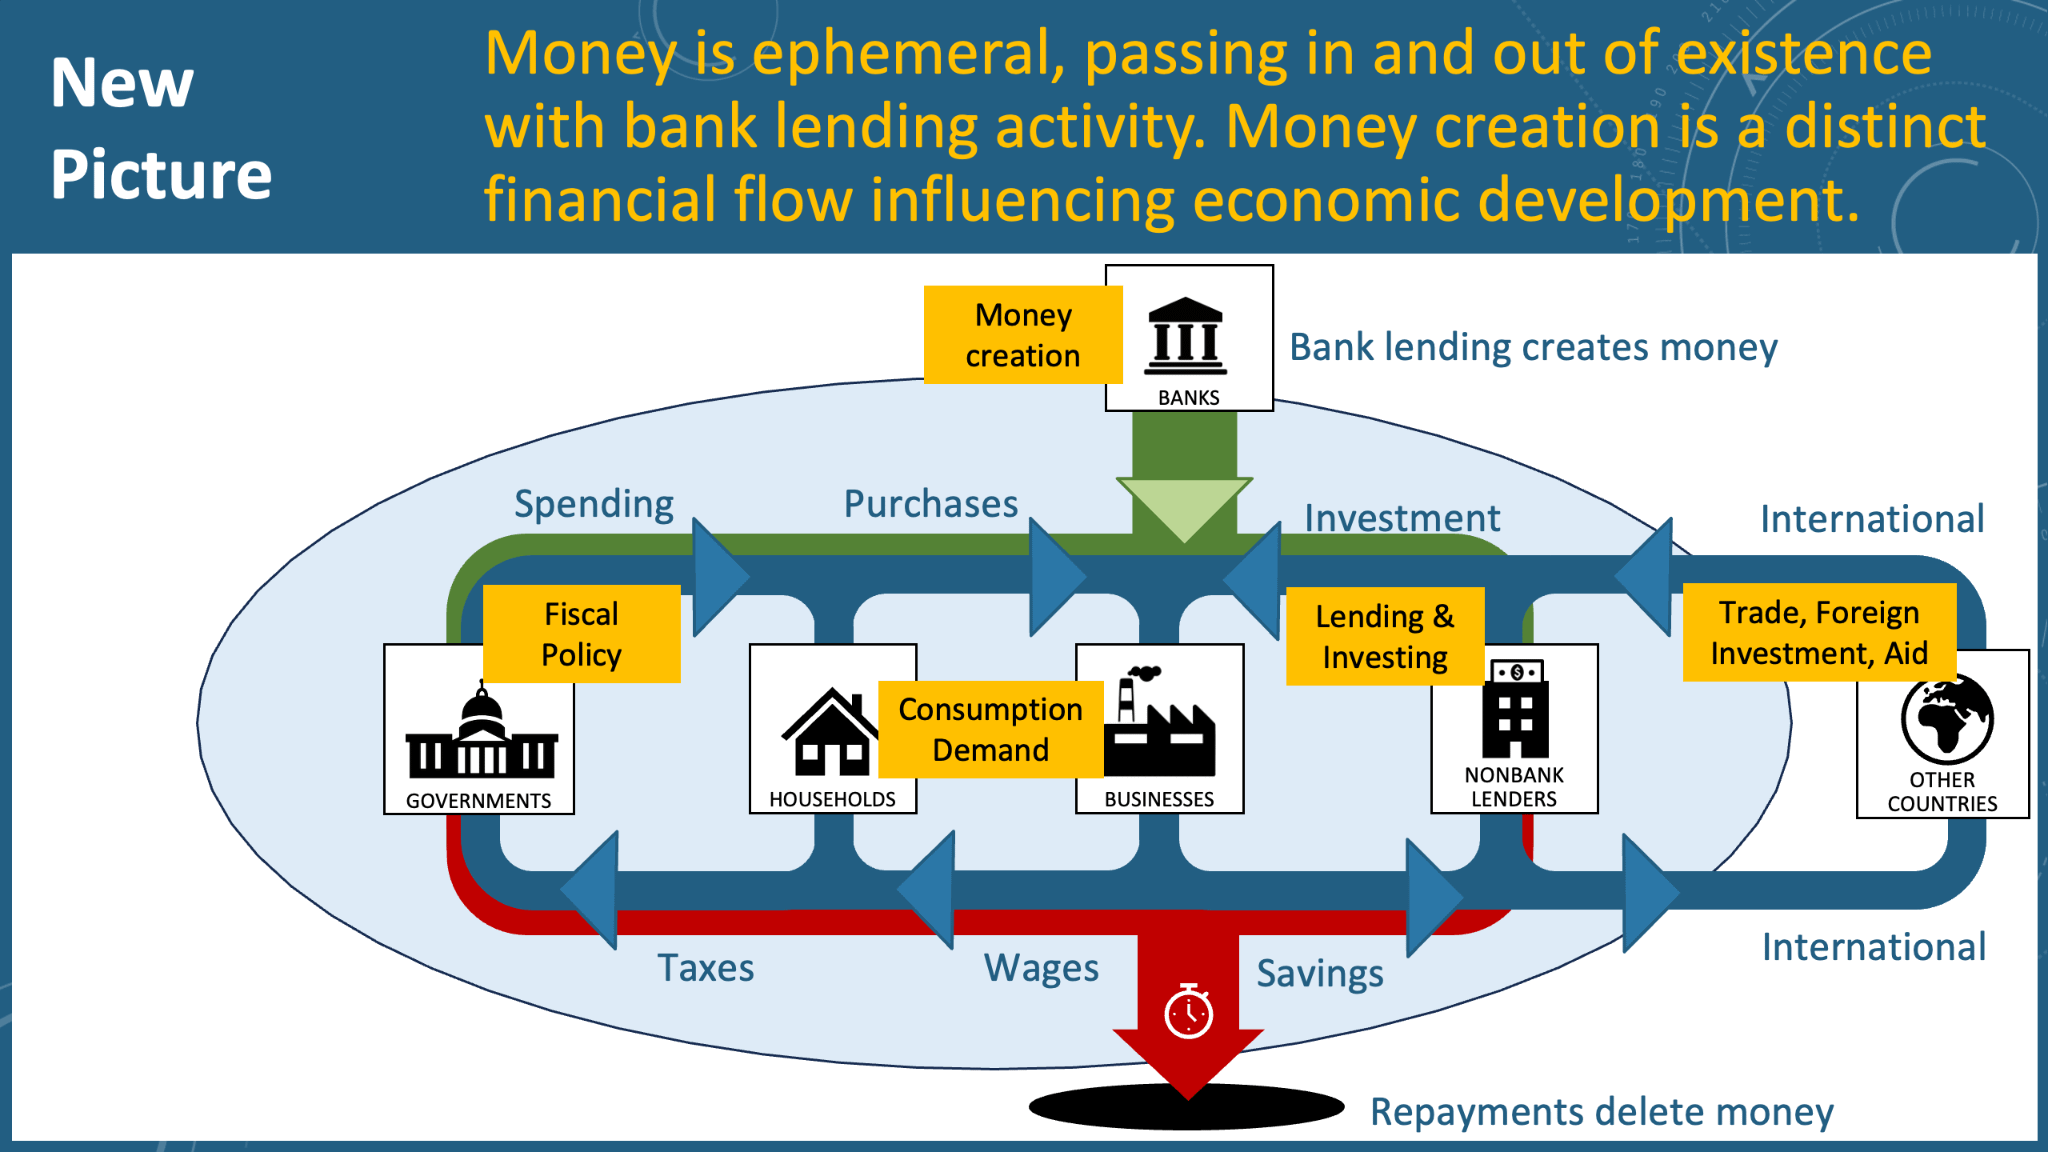
As we’ll see, it turns out that this “fifth financial flow” is tremendously consequential. It may be the single most powerful factor influencing whether and how economies grow (and shrink).
Are banks’ lending flows (money creation) really large enough to have such a huge effect? I thought I’d be able to answer the question in a couple minutes by looking up the gross flows of bank loan originations. It ended up taking a couple years to find the answer.
For a full explanation of how banks create money, I recommend the brief Banking 101 videos series by Positive Money or the book Where Does Money Come From? by the New Economics Foundation. In short, banks are able to create the money the lend thanks to a complex combination of accounting, law, and long-forgotten political calculus. It took me years of research to understand that. But understanding those aspects doesn’t explain one important thing…
How consequential is banks’ power to create money? Very!
As a result of the 2008 crisis, everyone understands that, in exceptional circumstances, bank decision-making can powerfully influence the overall economy. Under normal circumstances, however, banks are assumed to be a neutral conduit passing money from savers to borrowers and earning interest as a fee for that service. In fact, this is exactly how mainstream macroeconomists model banking, when they include banks in their models at all.
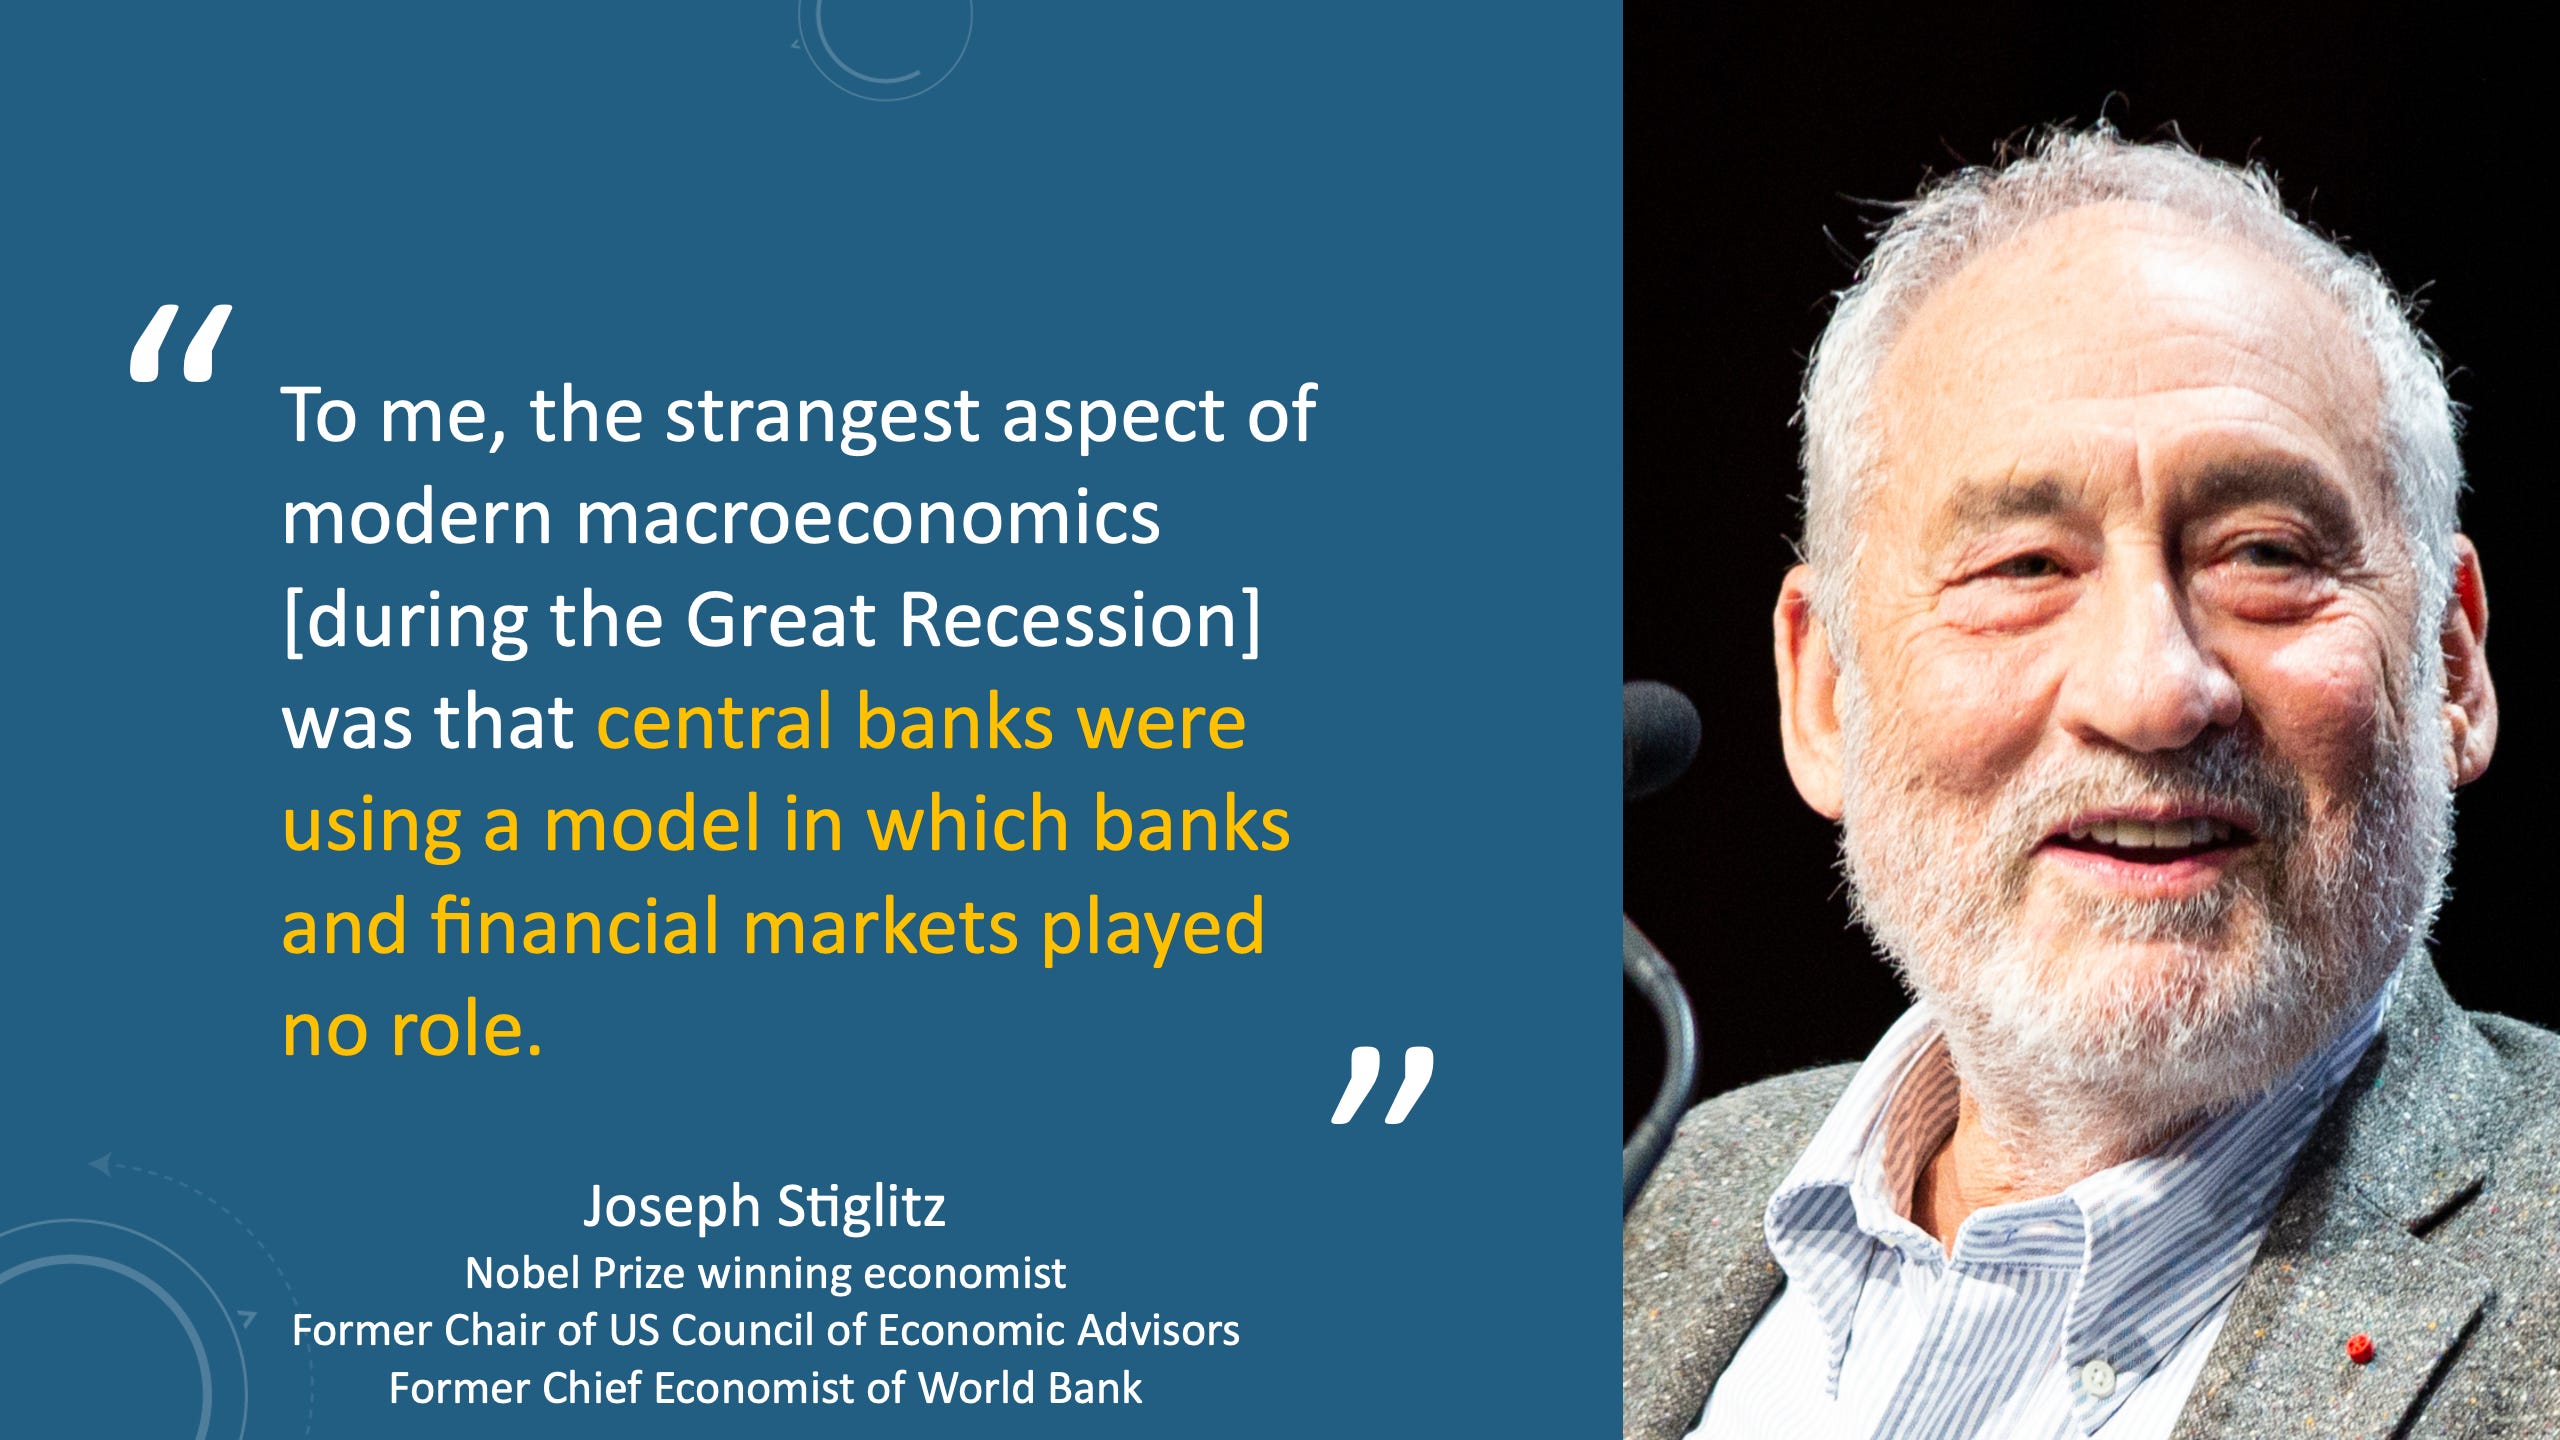
But if banks newly create 100% of the money they lend, we need a new explanation of banks’ role in the economy. We need a story that hinges on the reality that they create the money they lend, not on the fiction that they channel savings to borrowers.
Fortunately, non-mainstream economists, such as Post-Keynesians and Circuitists, have developed just such an explanation (see Chapter 3). They argue bank money creation is so consequential that it should be at the heart of macroeconomic modeling, not a bolt-on, as it is with mainstream economic models. They stand on solid real-world evidence. Their theory of “endogenous money creation” by banks was put to the test in the 2008 crisis and proved itself resoundingly. The few economists who predicted the crisis were those using the “stock flow consistent” macroeconomic models pioneered by these outsider economists.
Some mainstream economists did take note. Bank of England economists, impressed by the accuracy of models based on the theory of endogenous money creation, modified mainstream “equilibrium” models to incorporate the theory. They confirmed that models including bank money creation “predict changes in bank lending that are far larger, happen much faster, and have much greater effects on the real economy.” Another group of economists used the models to call into question mainstream monetary policy theories using four decades of real-world data from 177 countries.
Other mainstream researchers have shown that downturns in bank money creation (and deletion) explain and predict financial crises better than other macroeconomic indicators, including interest rates, inflation rates, GDP growth rates, investment rates, asset prices, credit spreads, and real credit growth. In other words, bank money creation provides better prediction of trouble than many of the “early warning indicators” used by central banks.
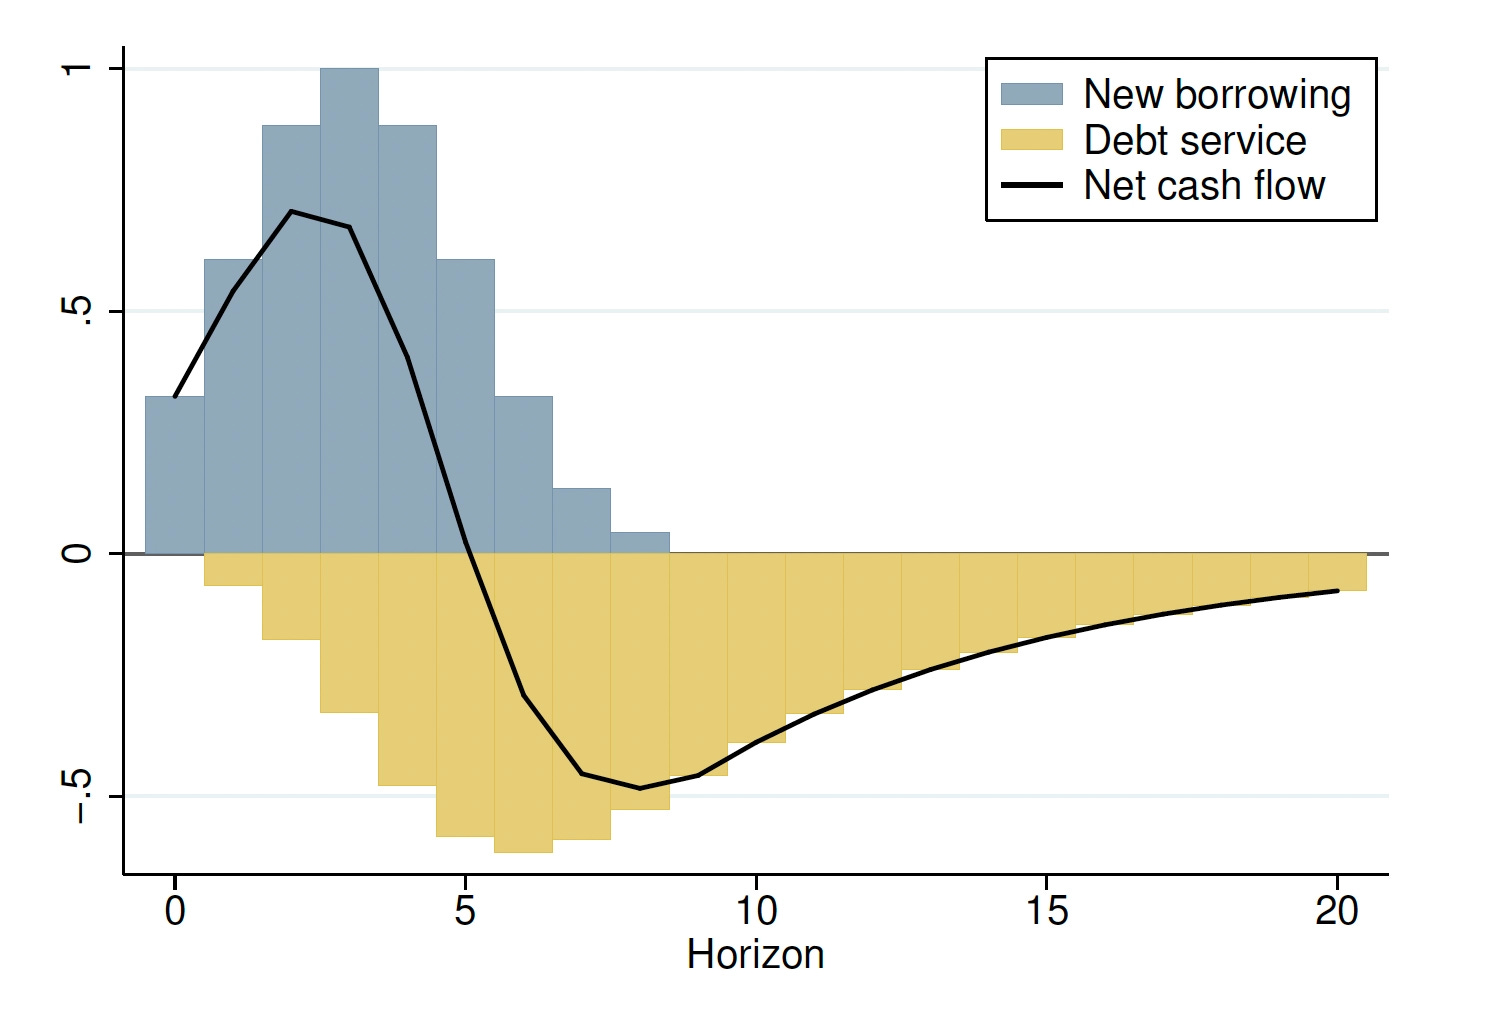
They’ve also shown that recessions led by contractions in bank money creation are deeper and longer, on average, than recessions with other causes, such as wars and natural disasters. Importantly, some argue that such recessions are an unavoidable feature of creating money through banking, given that economic expansions driven by bank lending are auto-correlated with contractions driven by loan repayments (money deletion). Fortunately, they’ve also shown that this insight can be used to rapidly end recessions!
These researchers are not outsiders, like the Post-Keynesians and Circuitists. They include mainstream economists at the European Central Bank, Bank of England, Bank of Finland, US National Bureau of Economic Research, and the Bank for International Settlements (“the central bank for central banks”).
Once I found this body of well-validated research that says, “Banks’ money creation is highly consequential and is highly predictive of how economies grow and contract,” I had a new question: Are banks’ lending flows (money creation) really large enough to have such a huge effect? I thought I’d be able to answer the question in a couple minutes by looking up the gross flows of bank loan originations. It ended up taking a couple years to find the answer.
Given the data challenges, one could forgive mainstream macroeconomists for their oversight. Nonetheless, the oversight obscures one of the largest and most influential financial flows in the economy.
The missing data
The most likely reason for mainstream economists’ omission of bank money creation from their macroeconomic models is the difficulty of finding data on bank loan originations and repayments. Net lending data is easy to come by, but that is only a snapshot in time, not a measure of the volume of bank lending taking place between reporting periods. Using net lending data to study bank money creation obscures potentially large shifts within the flow of loan originations (money creation) and repayments (money deletion). It also makes bank lending appear relatively insignificant relative to other economic transactions, generally less than 3% of GDP. Given those data problems, one could forgive mainstream macroeconomists for their oversight. Nonetheless, the oversight obscures one of the largest and most influential financial flows in the economy, as we’ll see below.
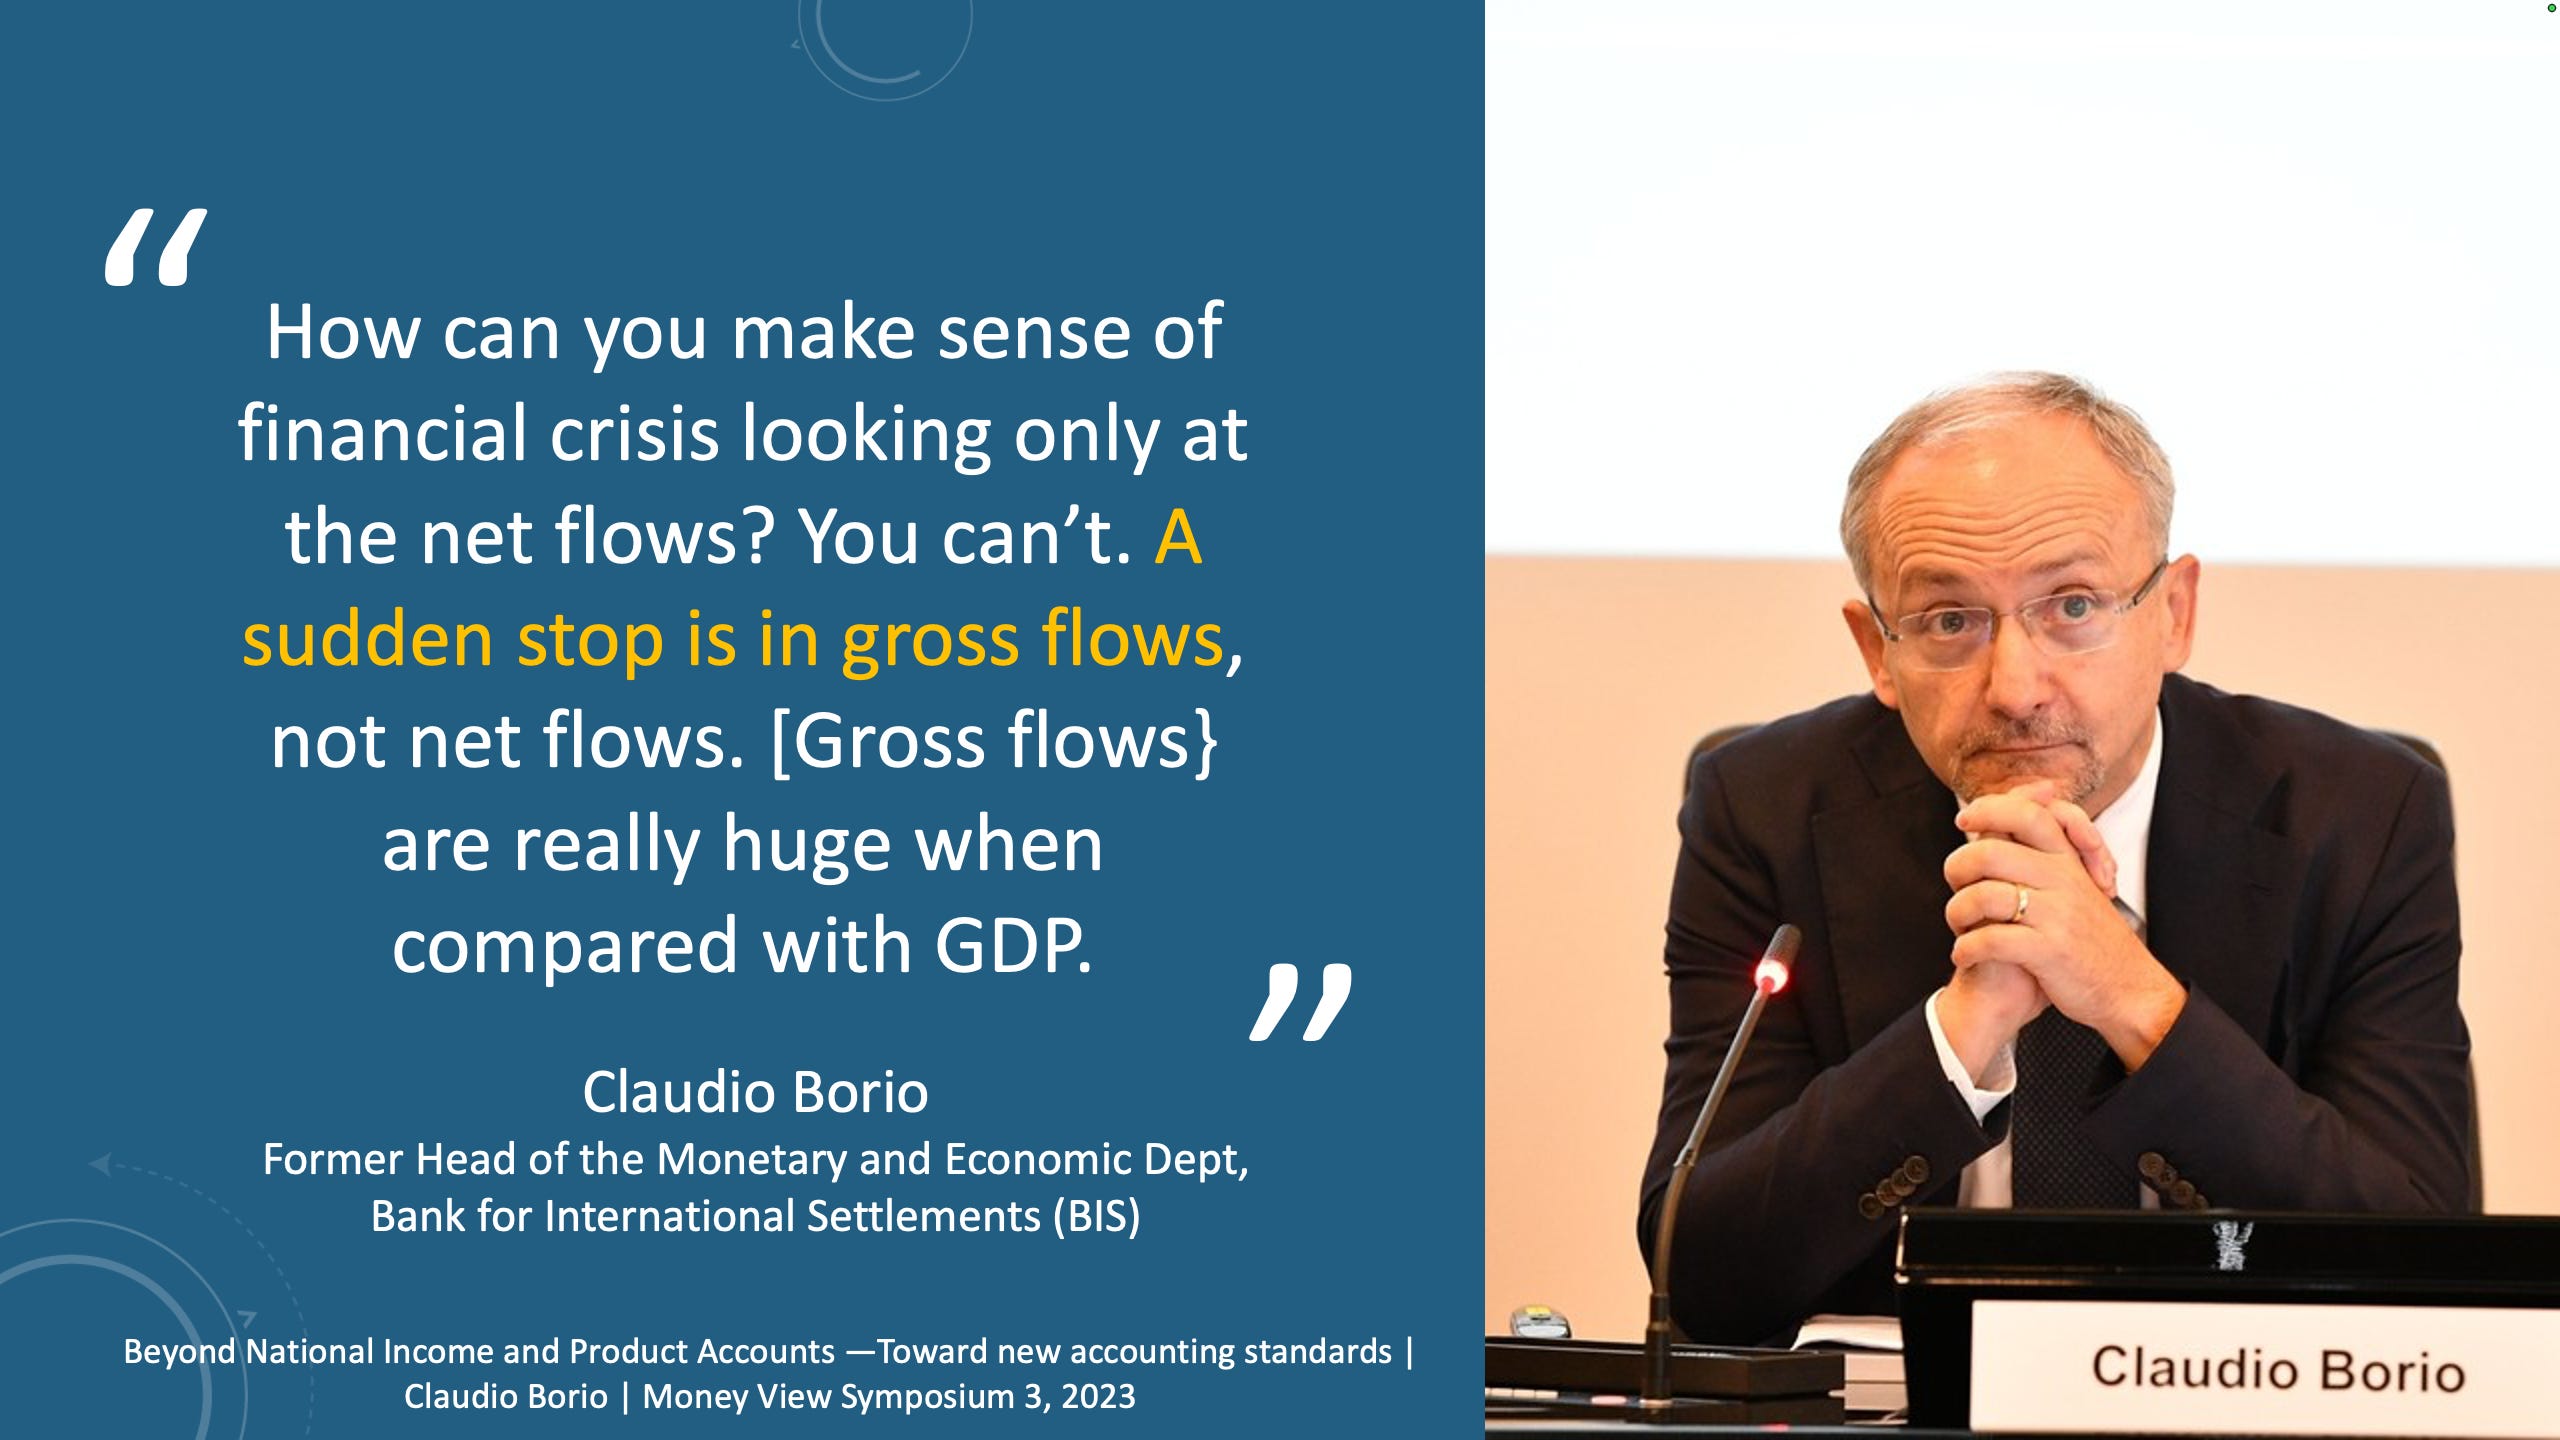
It’s important to note that this lack of gross flow data for bank money creation (loan originations) and money deletion (loan repayments) has been called out by mainstream economists at central banks, the institutions with the greatest ability to demand that banks transparently report the quantities of money they are creating and deleting.
Speaking at the Institute for New Economic Thinking’s Money View Symposium in 2023, the then Head of the Monetary and Economic Department at the Bank for International Settlements (BIS), said:
A similar call was issued by another economist at the BIS, along with economists at the Bank of Finland and the University of Virginia:
Given the important real effects of the flows between borrower and lenders, it is crucial to improve their measurement… This applies to the household sector and even more to the corporate sector, where these data are not very reliable. (Drehmann et al., 2018)
European Central Bank economists have made a similar call.
Unfortunately, central banks have not responded sufficiently to these calls. The data they collect today is incomplete or must be mathematically decomposed into origination and repayment flows. Nevertheless, a number of economists have taken on the challenge of extracting such data from the datasets that are available. That’s what we’ll turn to next.
How to deduce the scale of bank money creation
Despite the fact that datasets containing bank loan origination and repayment data are hard to find, incomplete, and must be mathematically decomposed to pull out the gross flows, it is possible to estimate the quantity of money banks are creating. I discovered this thanks to stellar work by researchers at the European Central Bank and the Macrofinance Lab at Beijing Normal University (BNU). The BNU team has yet to publish their work, so I’ve gotten their permission to share about it here. That’s the motivation for writing this piece. I haven’t seen numbers like their’s published anywhere else.
The BNU team built on the work of economists Ramón Adalid and Matteo Falagiarda at the European Central Bank. They developed a method to decompose the origination and gross flows of mortgage lending in Europe (a subset of total bank lending that could be readily decomposed because mortgages have known maturities, generally 30 years). After analyzing the data, Adalid and Falagiarda concluded that accurate gross flow data is crucial for improving macroeconomic models:
Using loan origination instead of net loans has important implications for understanding macroeconomic developments… especially after large booms… When net loans are replaced by loan origination, adverse credit supply shocks lead to a more negative impact on the macroeconomy… These results suggest that there is a premium on adjusting economic models that use lending as an input to account for loan origination and/or repayments. (Adalid 2019)
As the authors note elsewhere, decomposing mortgage lending flows reveals important dynamics but does not tell us about the total volume of all bank lending. That’s where the BNU team comes in.
Zijian Wang, Zifan Feng, and Yougui Wang built on the ECB researchers’ approach to decompose US bank lending data into origination and repayment flows. They had discovered that twelve data fields collected from banks by the Federal Deposit Insurance Corporation (FDIC) could be combined to capture the entire loan book of a bank grouped by maturities (e.g., three months or less, between three months to 12 months, one year to three years, etc). By conservatively estimating the average age of loans within each maturity group, they could produce a conservative estimate of the origination and repayment flows that were growing and shrinking a bank’s loan book. They then aggregated that data across thousands of banks to produce a dataset running from 1997 through 2022. This required downloading thousands of “call reports” submitted by banks to the Federal Deposit Insurance Corporation. That’s what I mean when I say the data can be hard to find.
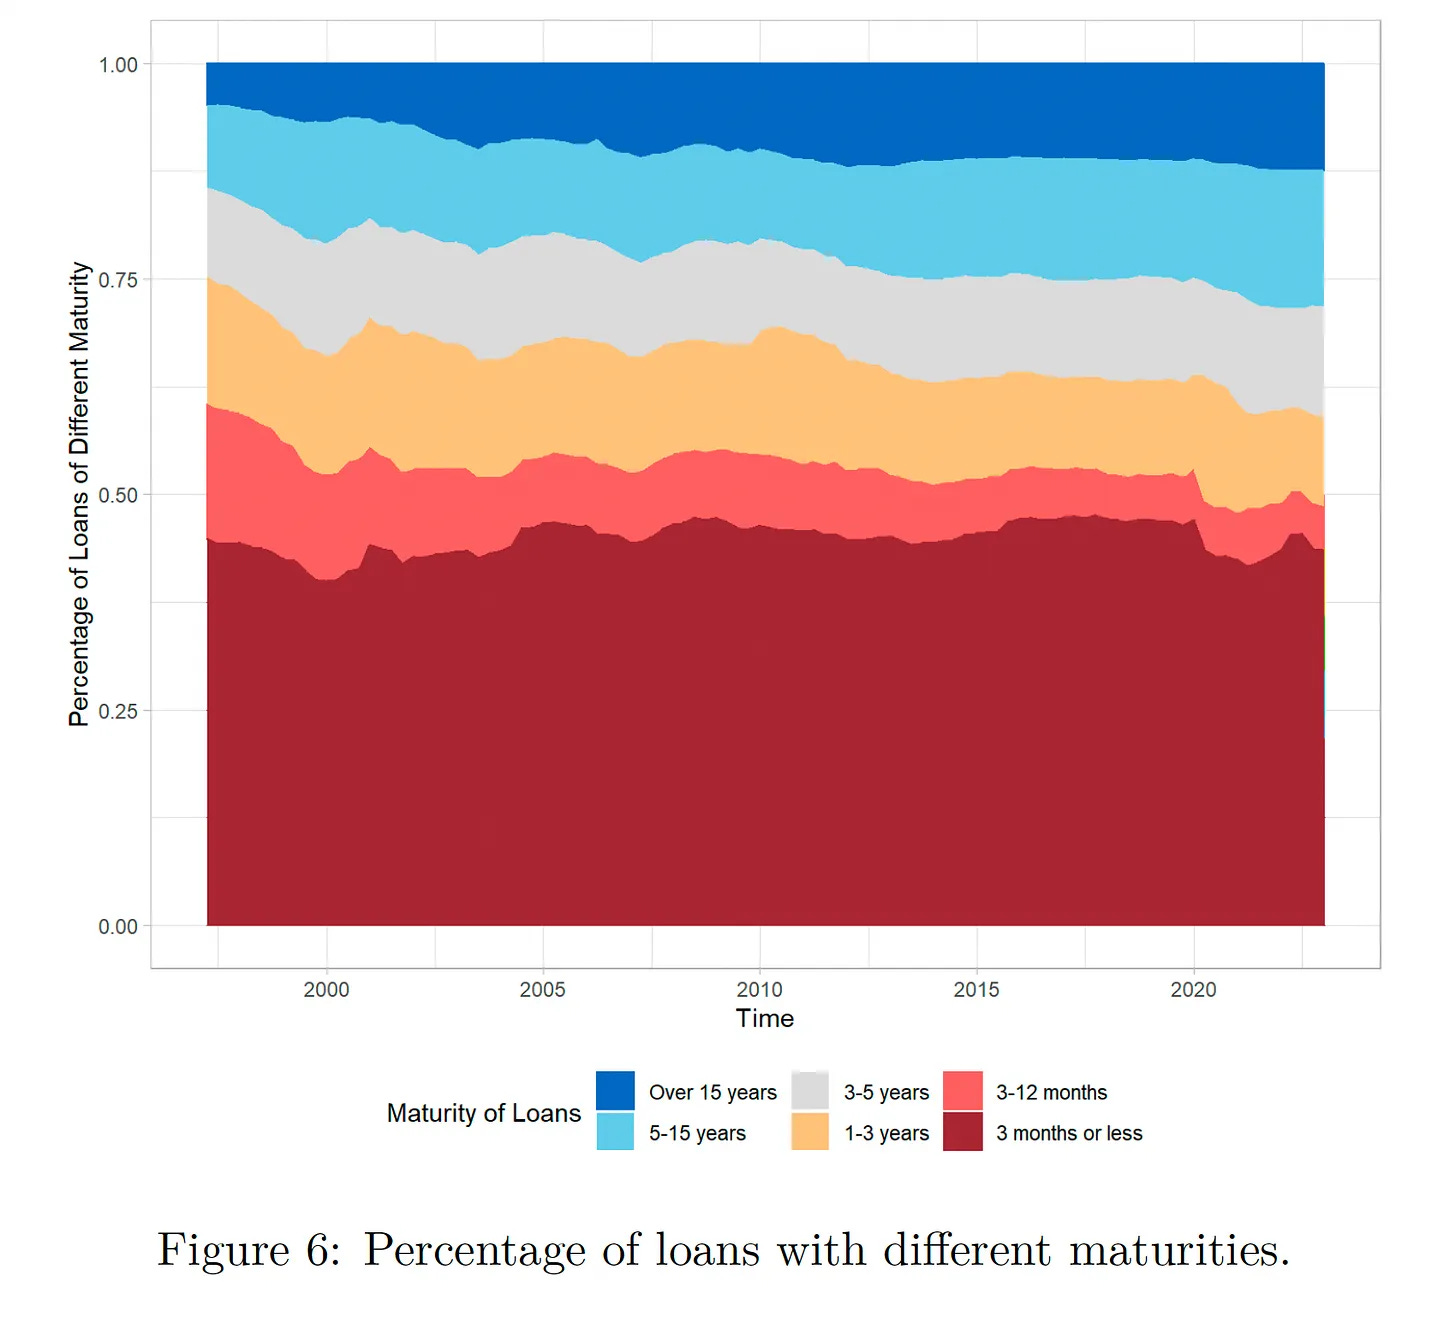
As can be seen in the chart below, they found that the origination and repayment flows (bank money creation and deletion flows) are quite large and fast moving. As much as 1/3 of the total money supply (measured as a stock) blinks in and out of existence every quarter. We’re talking trillions of dollars a month.
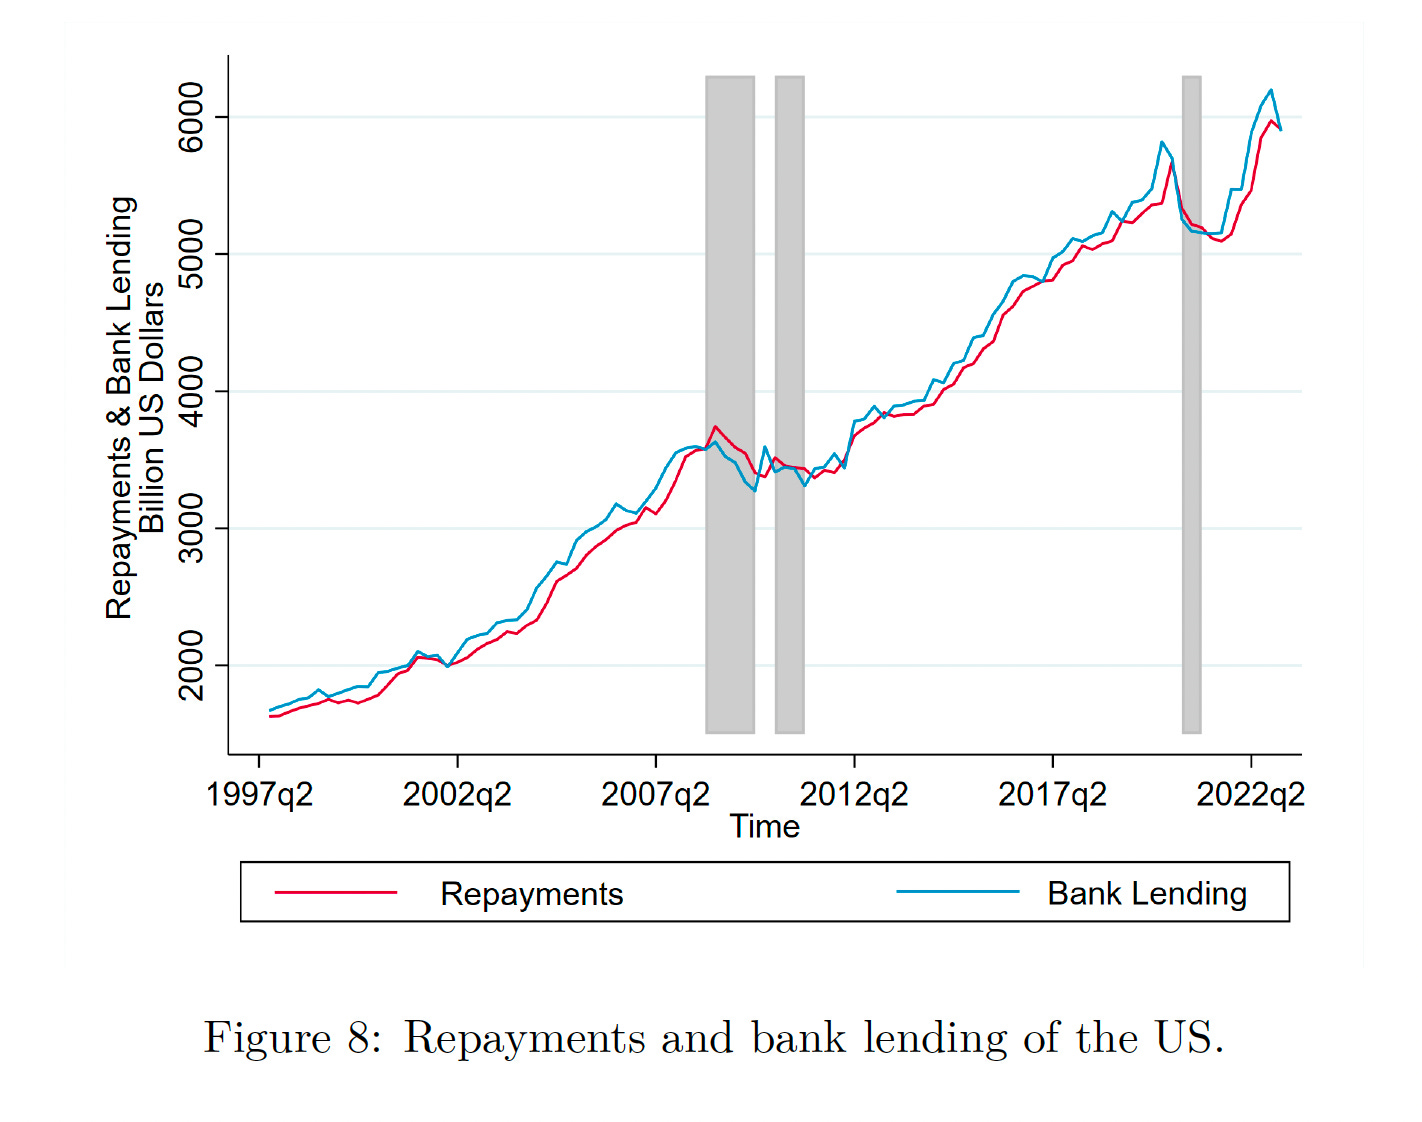
They also observed that origination flows dipped below repayment flows at the onset of recessions. While such a dynamic is visible in net stock data, the scale of the flows involved is not. Indeed, the 2008 crisis saw the origination flow (money creation) drop by half a trillion dollars in a short span. As BNP Paribas economists found, that drop is almost completely obscured in the money stock data most economists look at because it was masked by Federal Reserve and Treasury asset relief programs.
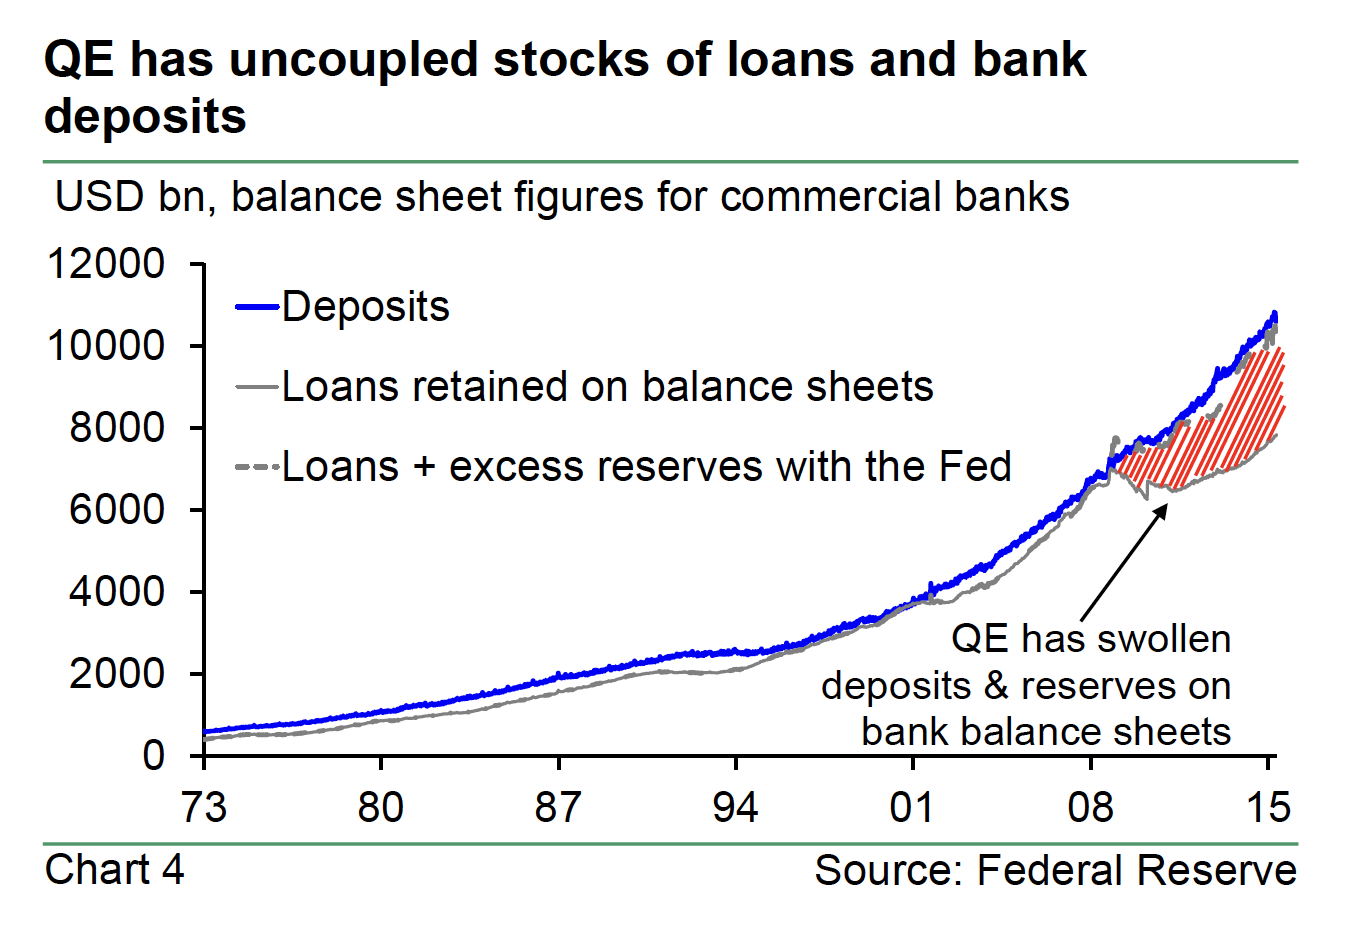
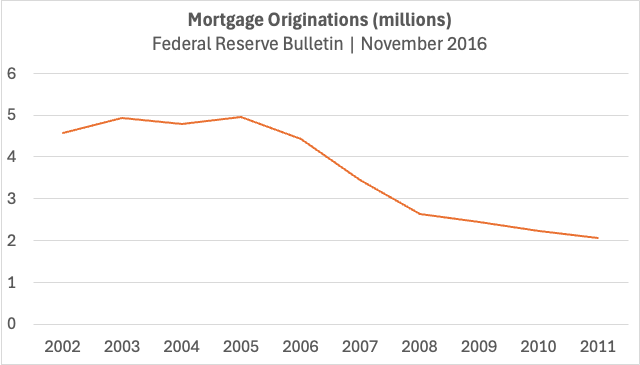
This matters because while the stock of bank money appears stable, the gross money creation flow shifted radically. The money creation induced by the asset relief programs flowed into securities markets, not into the mortgage market where loan origination (money creation) fell by 40% from pre-crisis levels. In other words, the location in which newly created money was entering the economy shifted dramatically. That shift forever changed the lives of millions of would-be homebuyers, home sellers, realtors, home builders, building material suppliers, governments, politicians, and retirees.
Coming back to the BNU team’s data, it’s important to note that their calculations necessarily underestimate the true volume of bank lending (money creation) because the FDIC call reports don’t capture lending that is originated and repaid within the 3-month reporting windows. That leaves out some short-term debt from leveraged trading, money market trading, credit cards, short-term inventory financing, etc.
Even so, the BNU team found that the majority of bank money creation is short term. In other words, a meaningful share of the money supply (up to 1/3) is extremely ephemeral because money creation (lending) is quickly followed by money deletion (repayment). This suggests that the economy, as a whole, is on a much shorter leash when it comes to the quantity of money in circulation (liquidity) than bank balance sheets suggest. Bank balance sheets are often interpreted as showing that long-term mortgages are the largest source of bank-created money. That is true from a stock perspective, but not a flow perspective.
This helps explain why in 2008 a withdrawal of short-term credit by banks could cause a deep and long-lasting economic recession. Some SFC modelers in the Post-Keynesian and Circuitist traditions have recently proposed a new model that better capture dynamics like this by explicitly modeling repayment flows. They note that including origination and repayment flows in the model better predicts and explains the kind of self-reinforcing downward spiral in lending (money creation) experienced during the 2008 crisis.
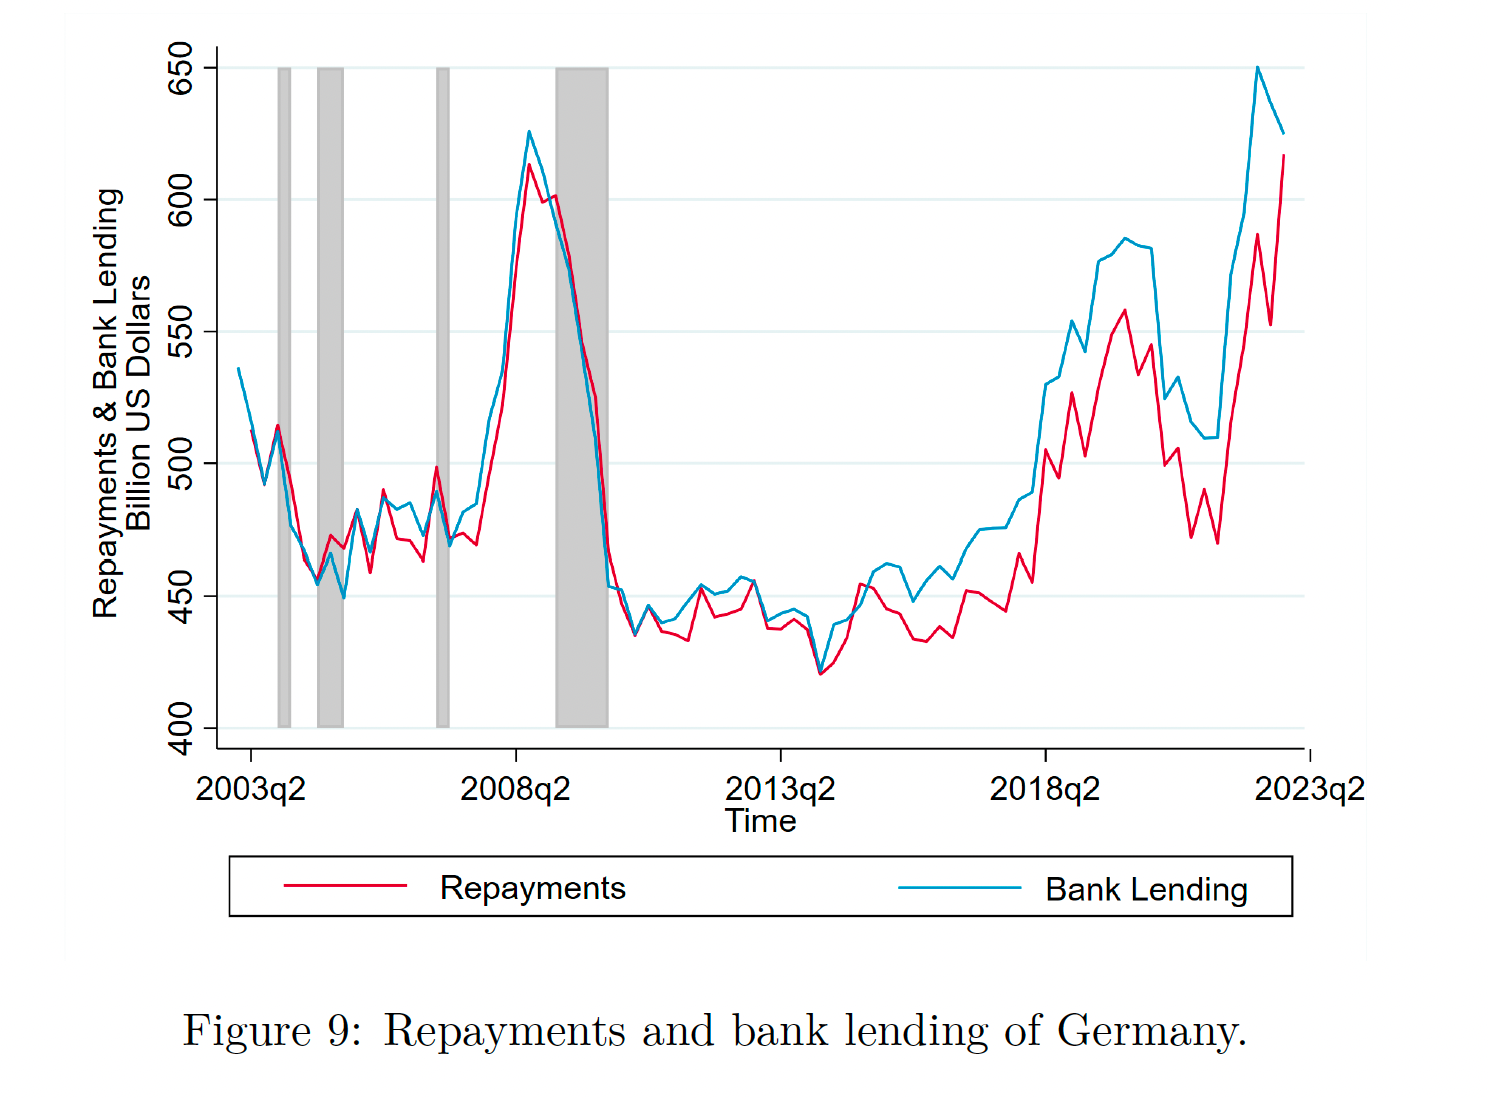
In addition to the US data, the BNU team used loan interest rate data collected by the European Central Bank to calculate the bank loan origination (money creation) and repayment (money deletion) flows for Germany. Again, the scale of the flows is quite large, in the hundreds of billions (USD) per quarter. Because Germany is part of the eurozone, it doesn’t have a measure of its money stock against which that flow can be compared, but it is surely a sizeable share.
Banks create more money than their nation’s citizens spend
To put the above money creation and deletion flows into perspective, I like to compare them to Gross Domestic Product (GDP) in “normal” pre-COVID years (2016-2019). GDP is the sum of all the money spent on finished goods and services within a country in one year. Thus, it is also a flow variable, like money creation and deletion.
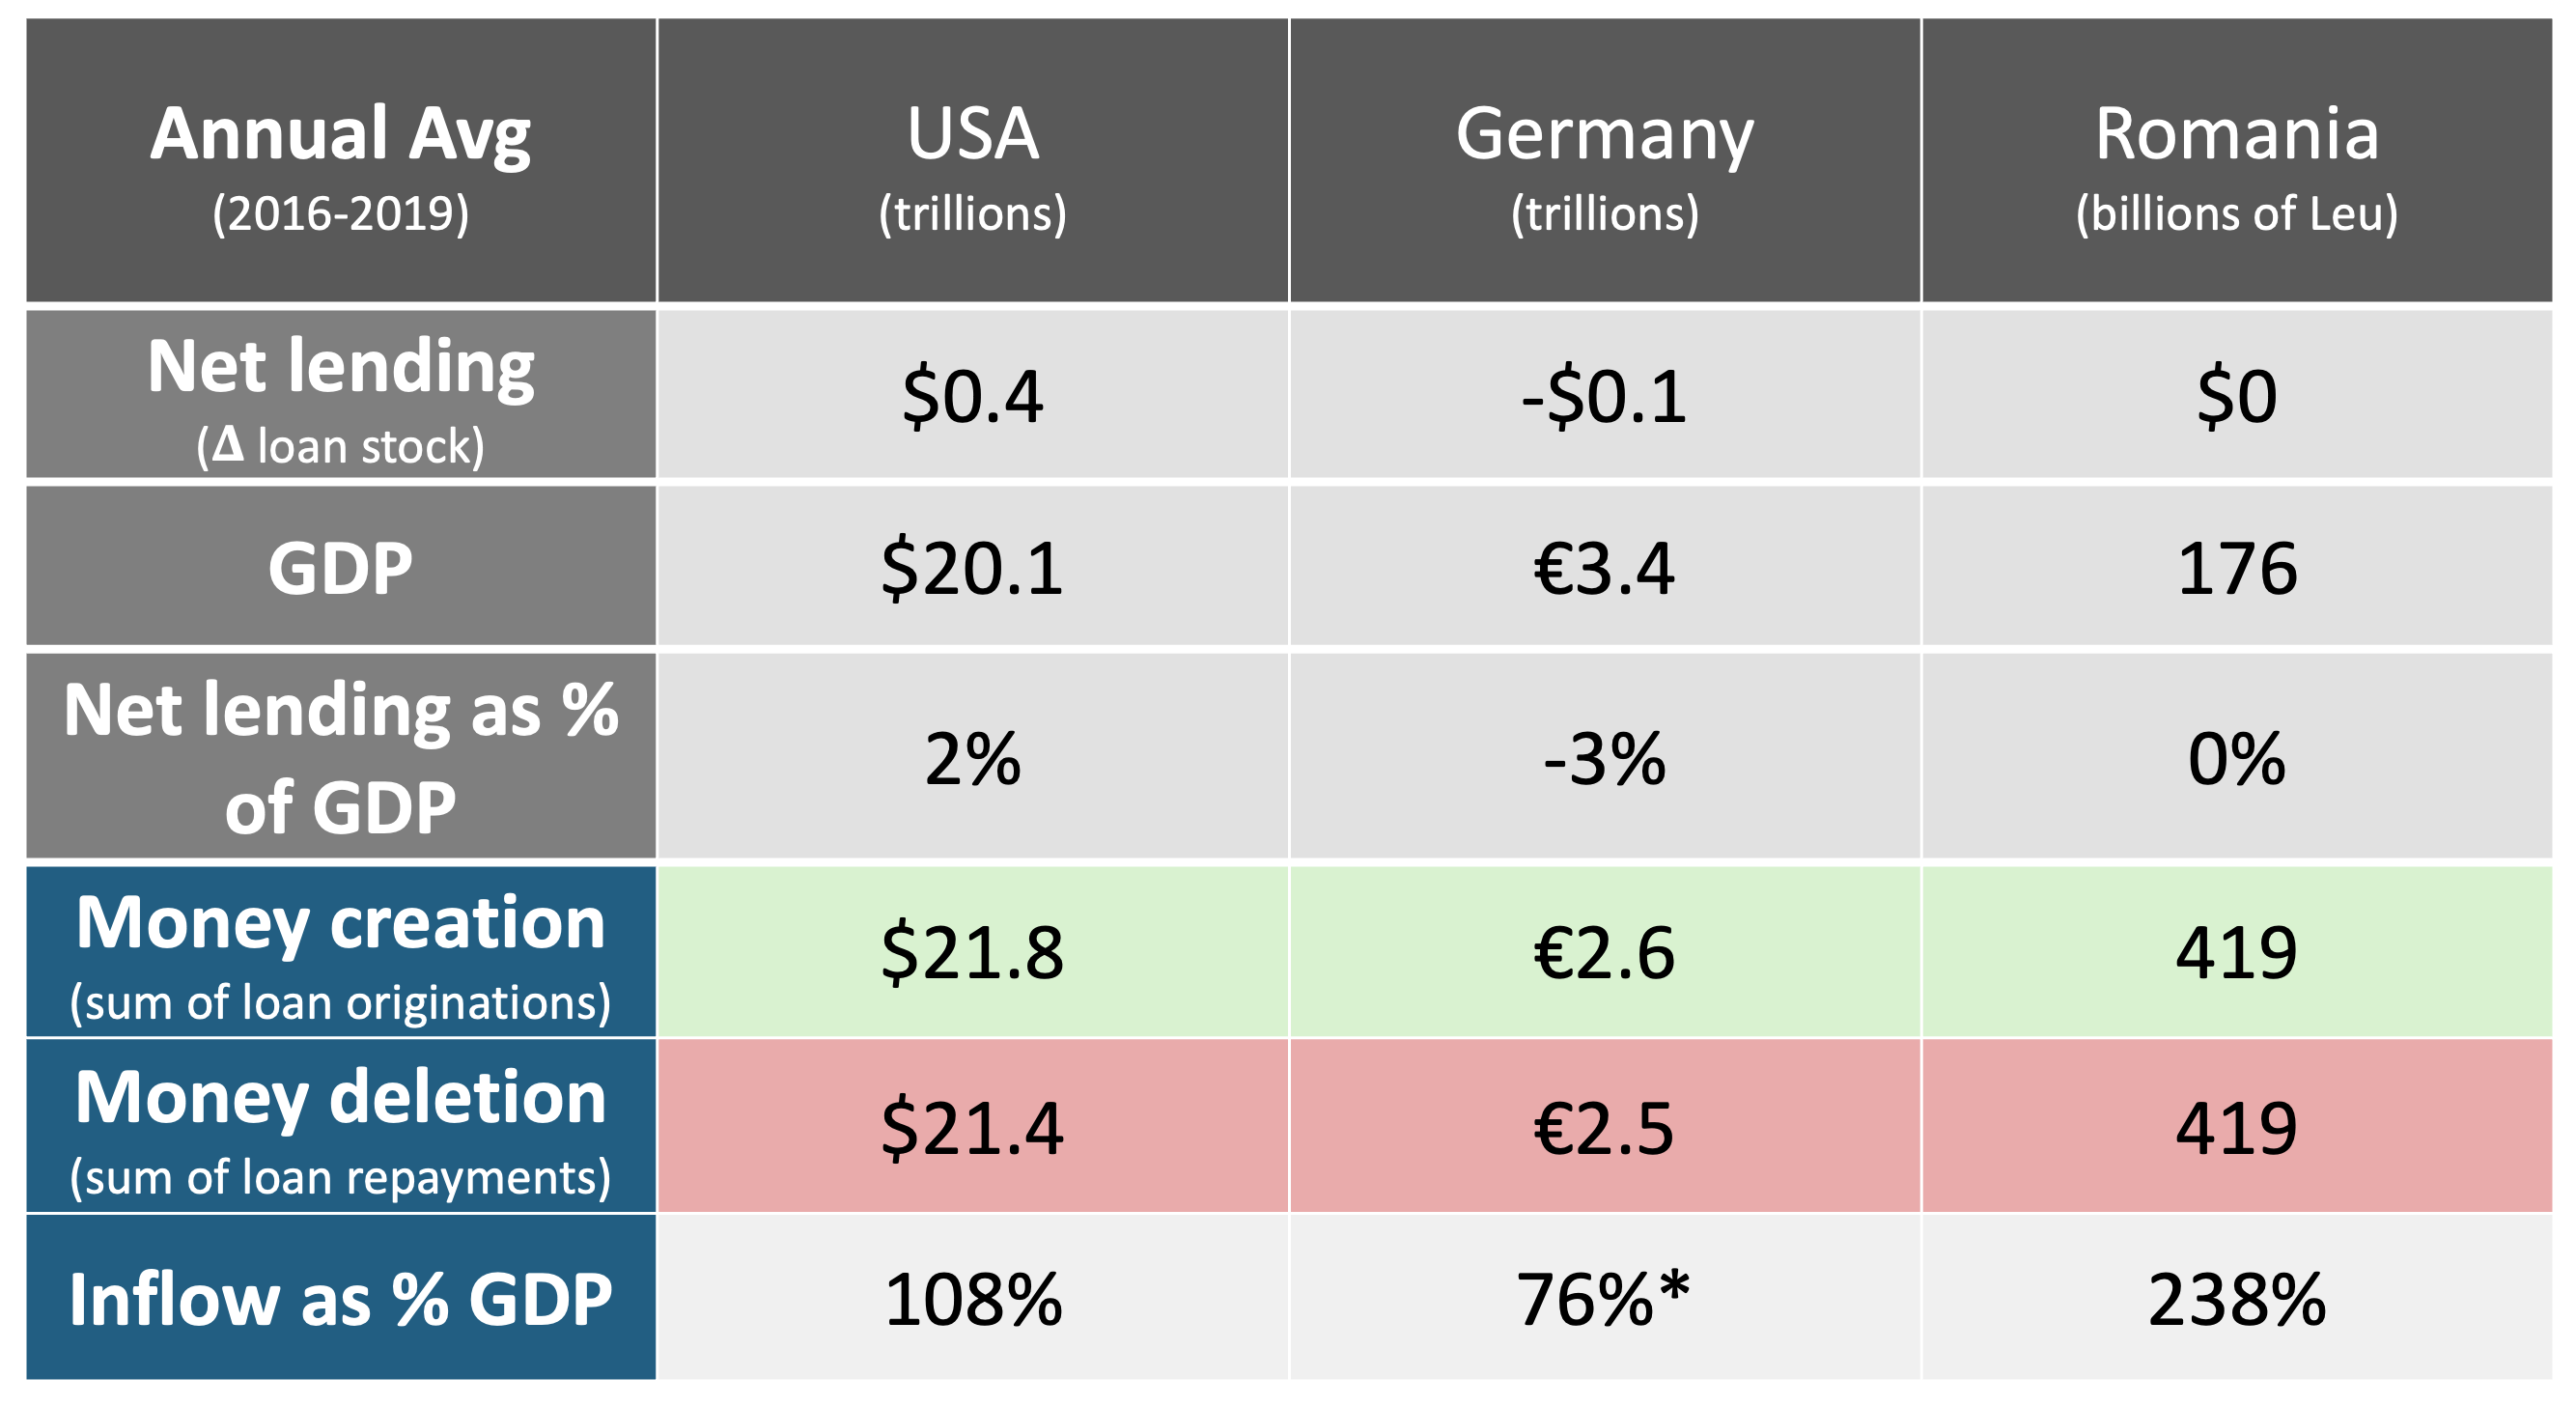
In the first three rows of the below table, you can see the net lending data that economists typically work with. When looking at banking through net lending data, it appears to be a relatively insignificant factor in a country’s overall economic activity (as measured by GDP), under 3% +/-.
In the bottom three rows, you can see the money creation and deletion flows. In absolute terms, they are huge. In the US, during 2016-2019 banks created, on average, $21.8 trillion per year compared to $20.1 trillion spent on all finished goods and services in the economy that year. It is possible for bank money creation to outpace GDP because a significant portion of bank borrowing is for purchases that are not finished goods and services and therefore not included in GDP. These include intermediate products, inventory purchases, and financial assets, such as real state. So the purpose of the comparison isn’t to say that there is a one-to-one relationship between dollars spent and dollars lent. The comparison is simply to say that, in macroeconomic terms, bank money creation is a very large financial flow.1
Does it matter that banks are creating so much money?
When I show these volumes to economists, I typically get three reactions:
Surprise
Nearly everyone is surprised by the scale of these money creation and deletion flows, even the Post-Keynesian and Circuitist economists who give meaningful attention to bank money creation and deletion. Even they didn’t know the flows were so large. So, surprise is usually the first reaction.
Dismissal
The second reaction, which comes faster or slower depending on how invested the economist is in using economic models that leave out bank money creation, is the following: “But it doesn’t matter how big the flows are because the inflow and outflows mostly cancel out, so they have no effect.”
Putting aside the above evidence that these flows do have significant macroeconomic effects, it’s a little strange to dismiss out-of-hand the idea that the creation of trillions of dollars per quarter (up to 1/3 of the total money supply) could have no macroeconomic effect!
But I understand where it comes from. Mainstream economists have been taught that as long as the money supply doesn’t grow too fast, there’s no problem. Because bank money creation has been obscured by an incorrect story of how bank lending works, data unavailability, and models that leave it out, mainstream economists never really had an opportunity to consider the possibility that the flow of new money into and out of the money supply could be so massive that the flow, not the stock, could be the greater concern.
Exceptionalism
The third reaction I sometimes get, especially from scholars in Global South countries, goes like this: “That could be true in the US and Europe where everybody uses banks and the economy is highly financialized, but it doesn’t apply to countries where many people don’t use banks, many transactions are settled with cash, and nobody can get loans.”
The first time I heard that I thought they had to be right. But then I looked at the data for countries with low bank utilization and high cash utilization, such as Morrocco and Romania. (I’ve included Romania in the above table because I could pull data for Romania from the same ECB data warehouse as the German data, making it an apples to apples comparison.) I was surprised by what I found. The numbers are similar. Even in countries with low bank utilization and high cash utilization, banks are creating and deleting huge amounts of money relative to the money stock and GDP.
It made sense once I thought about it more. Just because ordinary citizens can’t get loans and are having to scrape by with pocket cash doesn’t mean that nobody in the country is taking out loans. Many Global South countries are import and export dependent economies where the private banking industry was established by European colonizers for the express purpose of financing (creating money for) corporations producing for export or conducting import/export trade. Banks in those countries are still doing a ton of money creation to finance those same industries, the general population just doesn’t have access to the money creation spigot.
The profit motivations of banks decides who gets to benefit from the creation of their nation’s money supply
Earlier, I pointed to robust research to argue that the scale and flow of bank money creation matters because it powerfully modulates and predicts the overall performace of the economy (growth, crash, recovery). But that’s not the reason I really care about bank money creation.
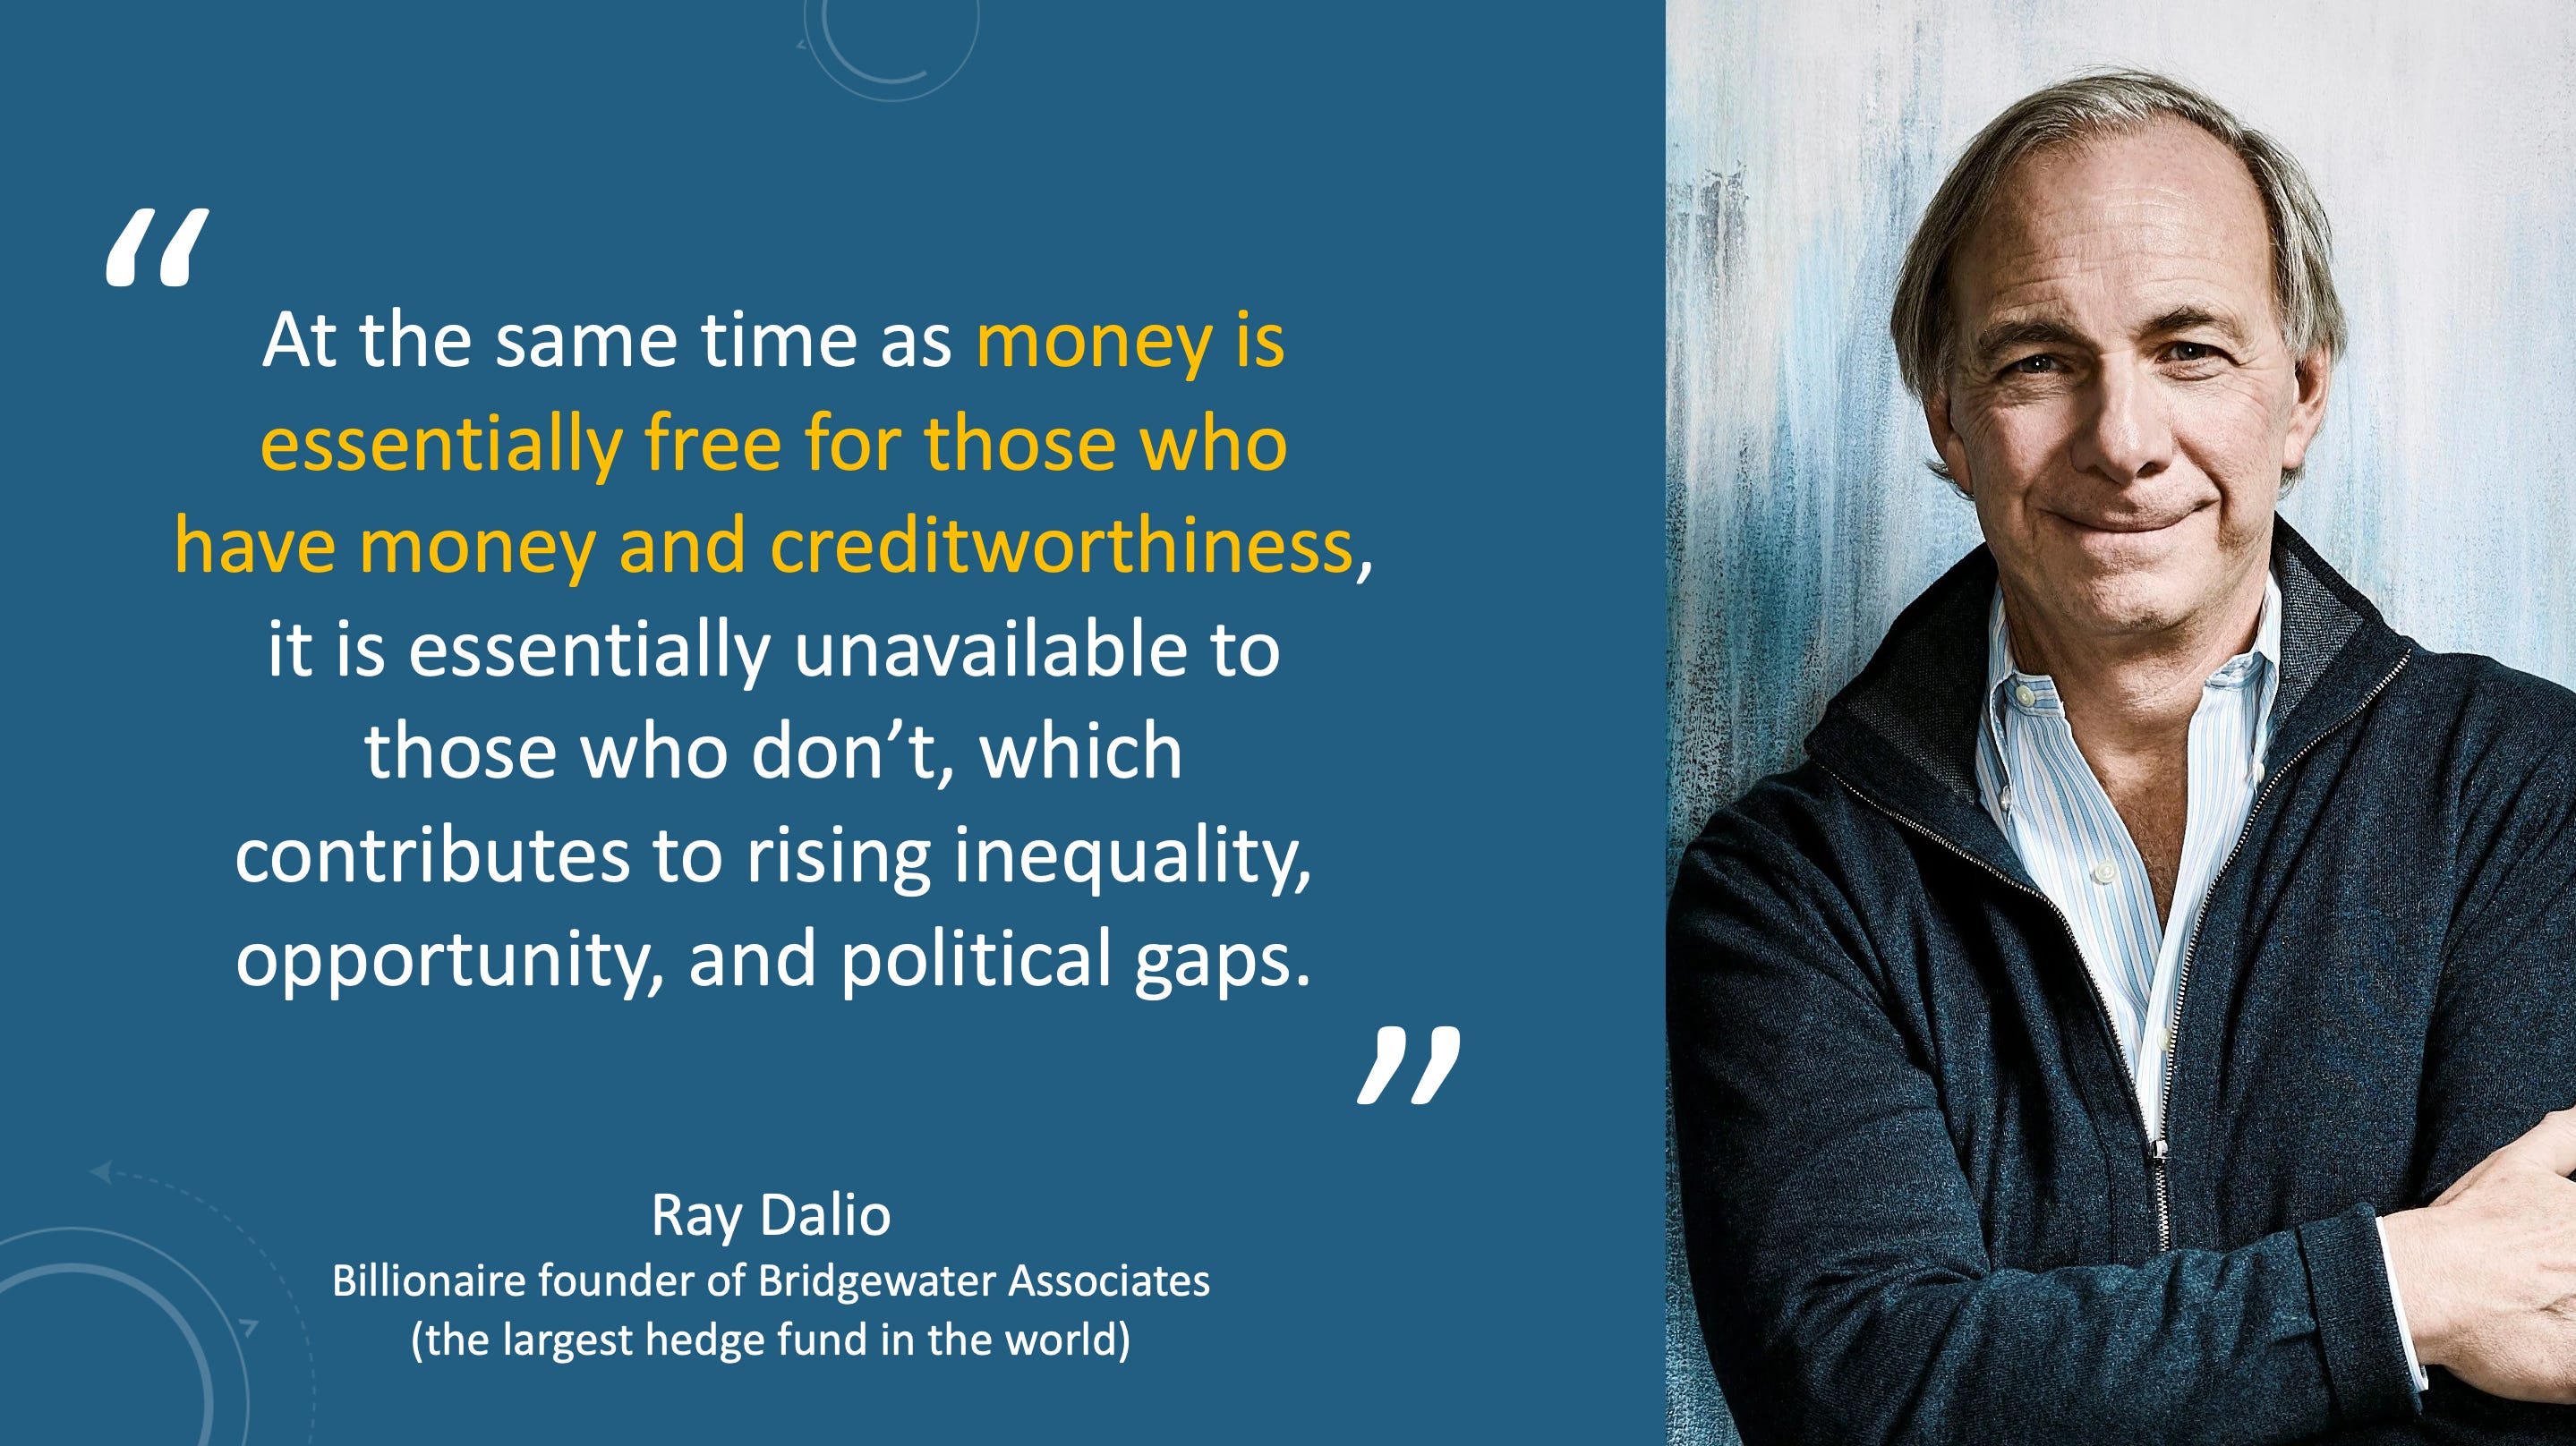
I care because when banks have the power to create money (and huge quantities of it) their decisions powerfully shape the economies we live in. Projects that will produce a profit for bank shareholders can always find investment because banks can create money for them. Projects that produce no profit or low profit for banks don’t get the same benefit. So, when governments outsource money creation to private for-profit banks we get economies that are optimized for bank profit maximization, not quality of life or the public interest.
These money creation statistics aren’t just numbers. They represent “red light” and “green light” decision-making power. What the table above shows us is that the US government’s decision to outsource money creation to banks meant that between 2016-2019 US banks got to green light $21 trillion in economic activities every year, on average. We don’t know how much they red lit (rejected) because banks aren’t required to report on the loan and credit applications they reject (the money they decided not to create).
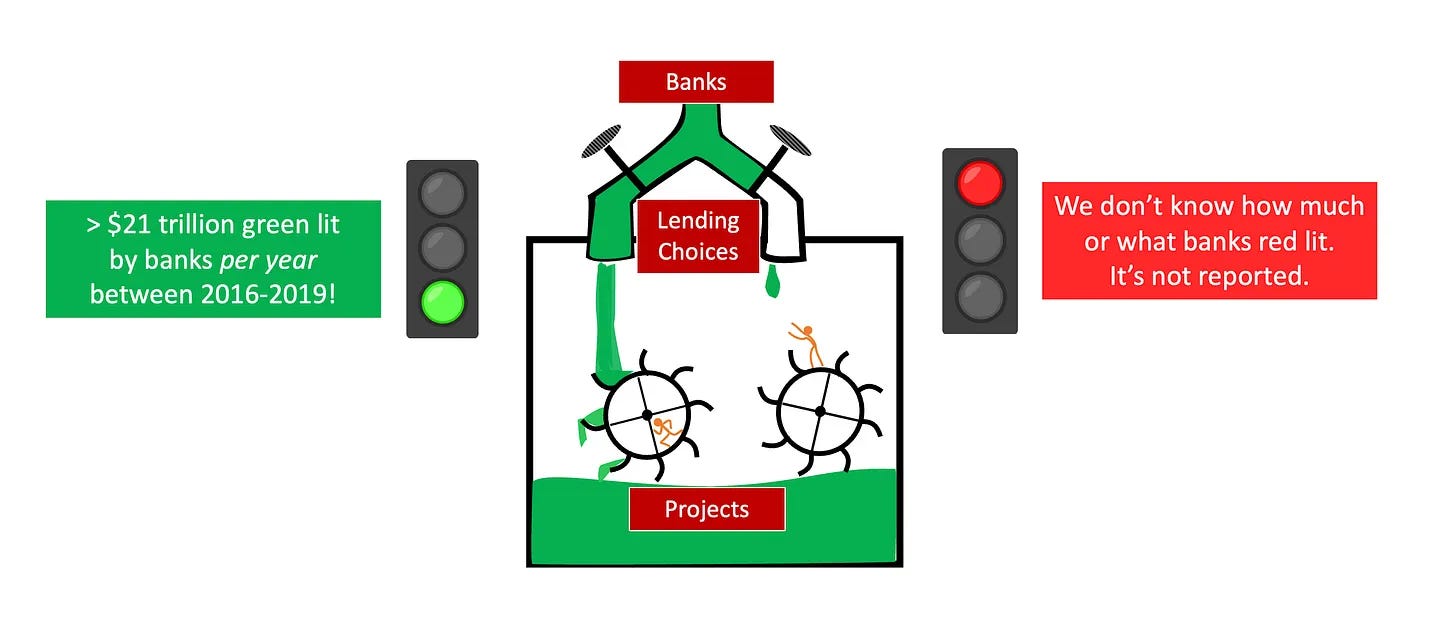
But we do know something about what is happening within the red lit category. Borrowers who don’t qualify for bank loans or are rejected include a disproportionate share of small businesses, lower wealth households, women, people of color, local governments, renewable energy companies, cooperatives, and more. This is simply because these groups generally can’t offer as large or safe a profit for banks and their shareholders. The safest borrowers for banks are already-wealth households and corporations who can put up collateral or share monopolistic profits.
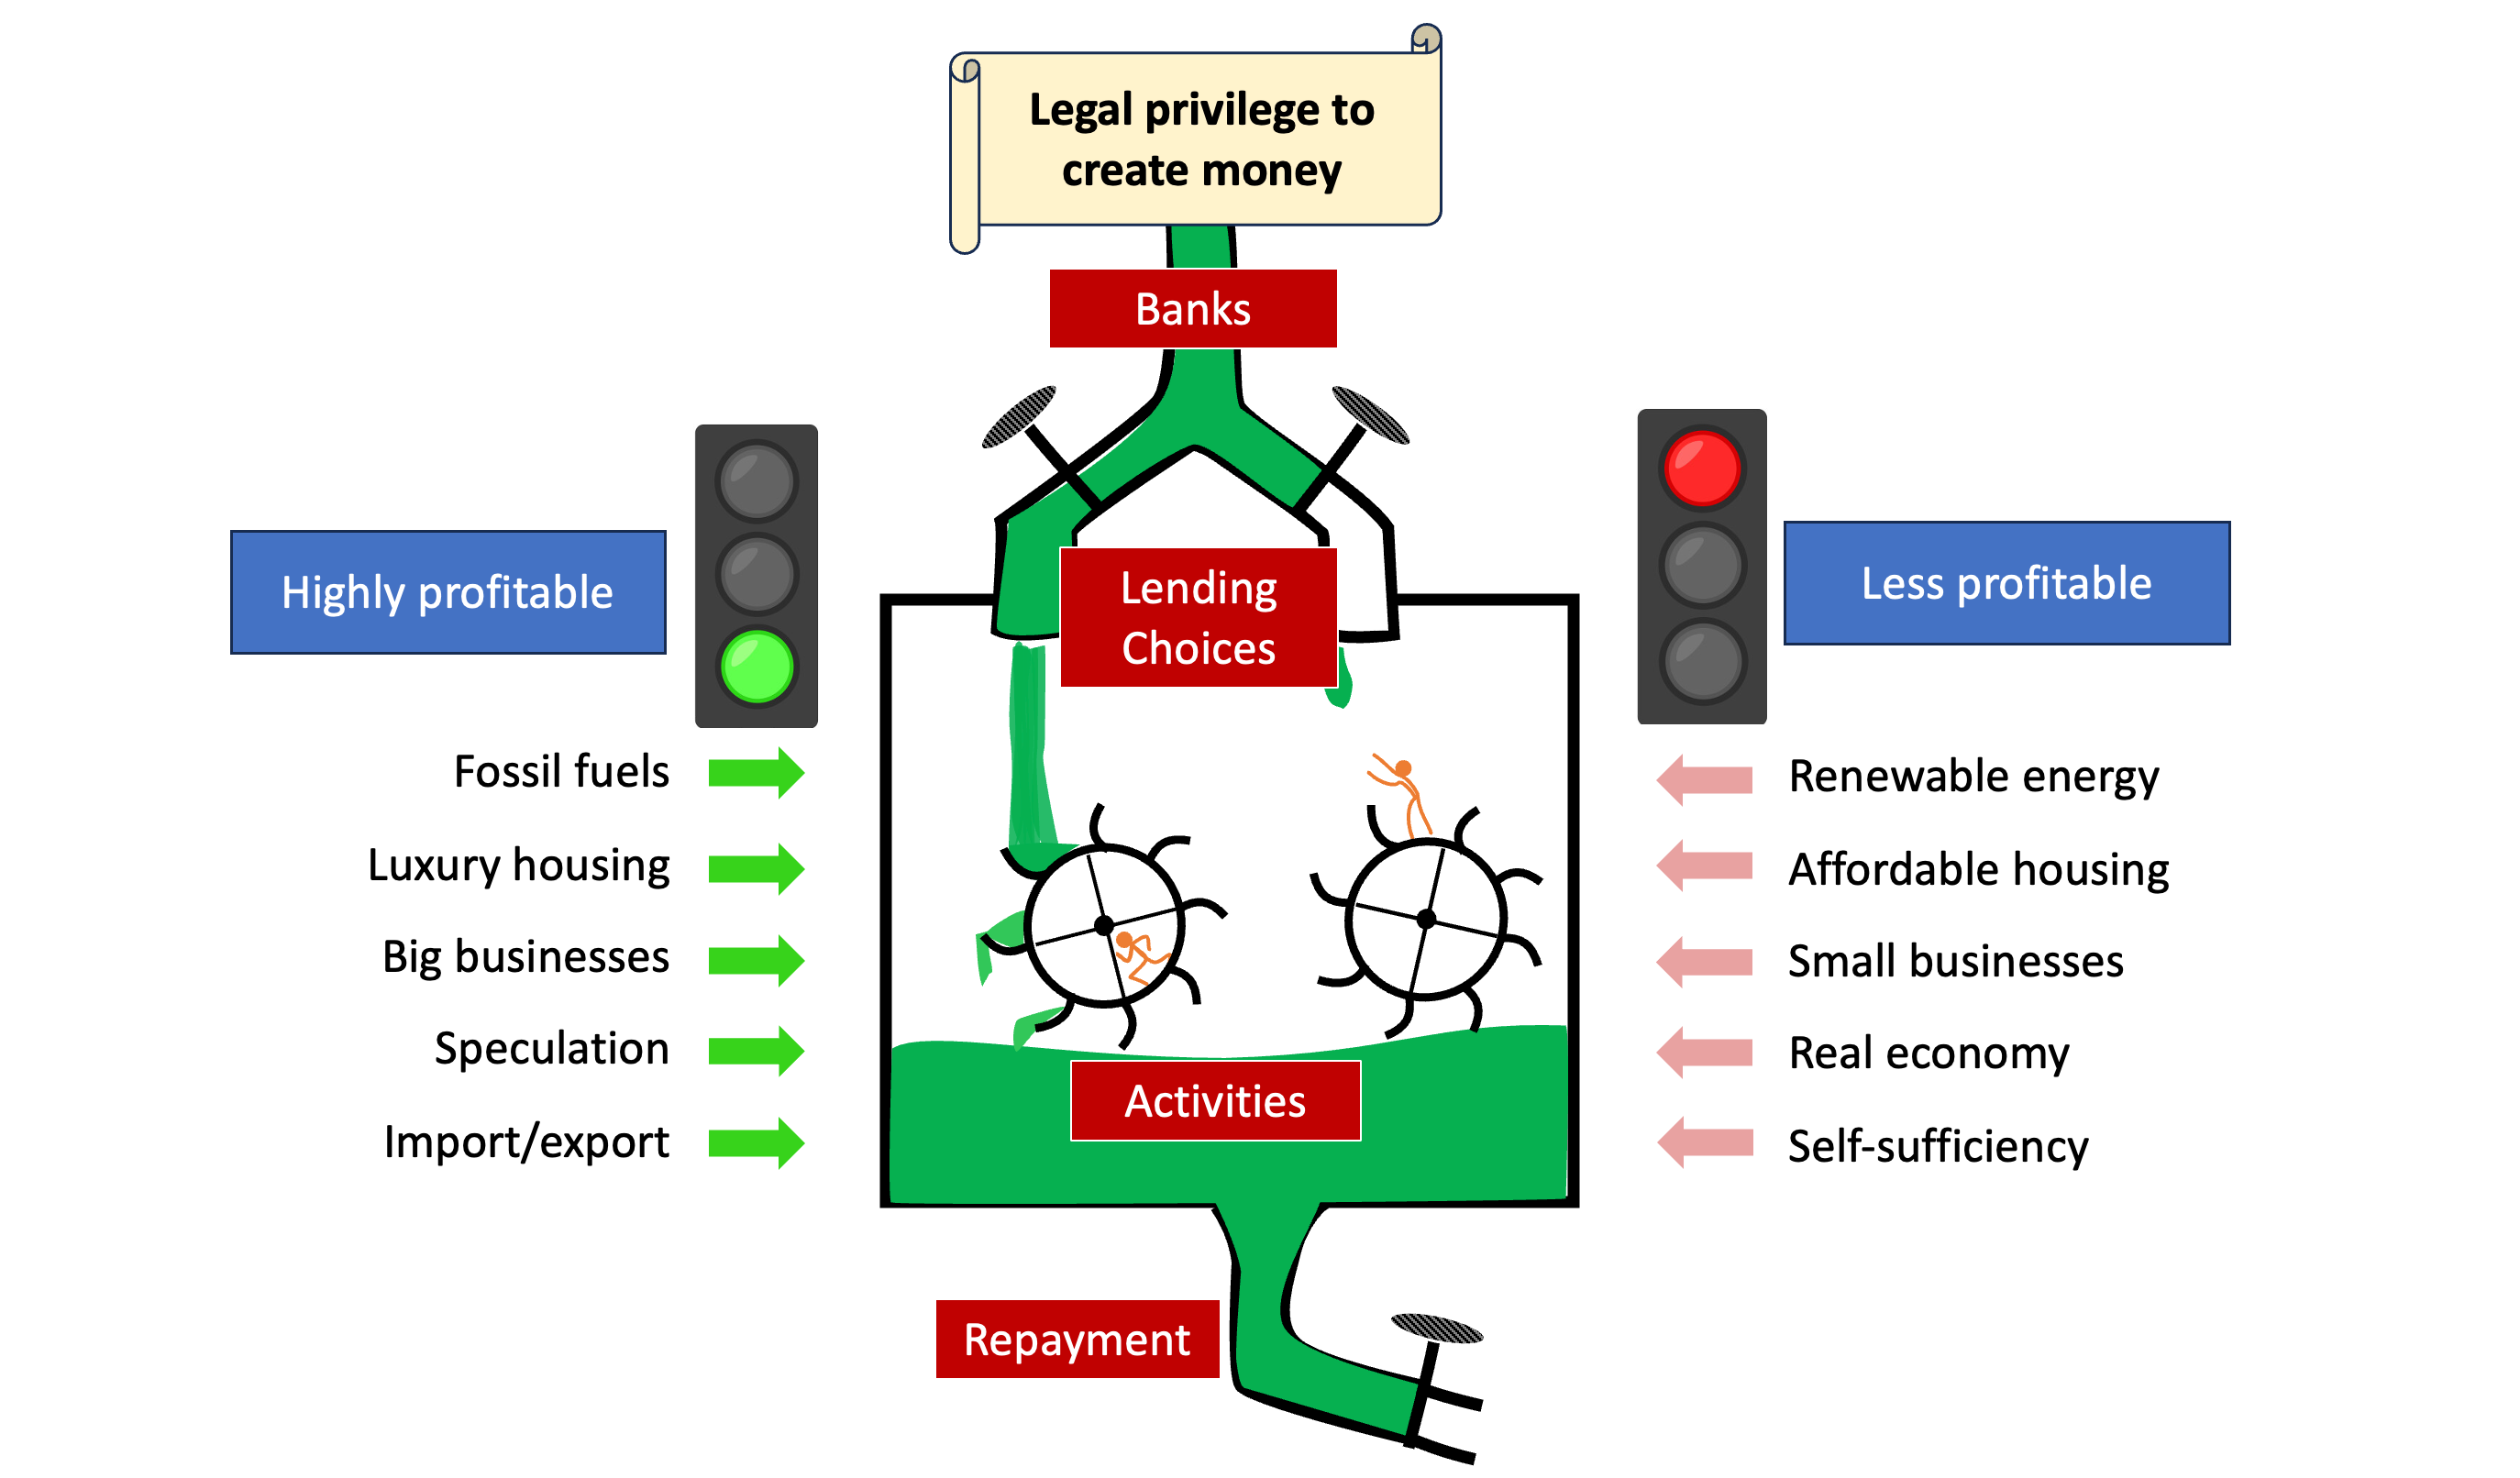
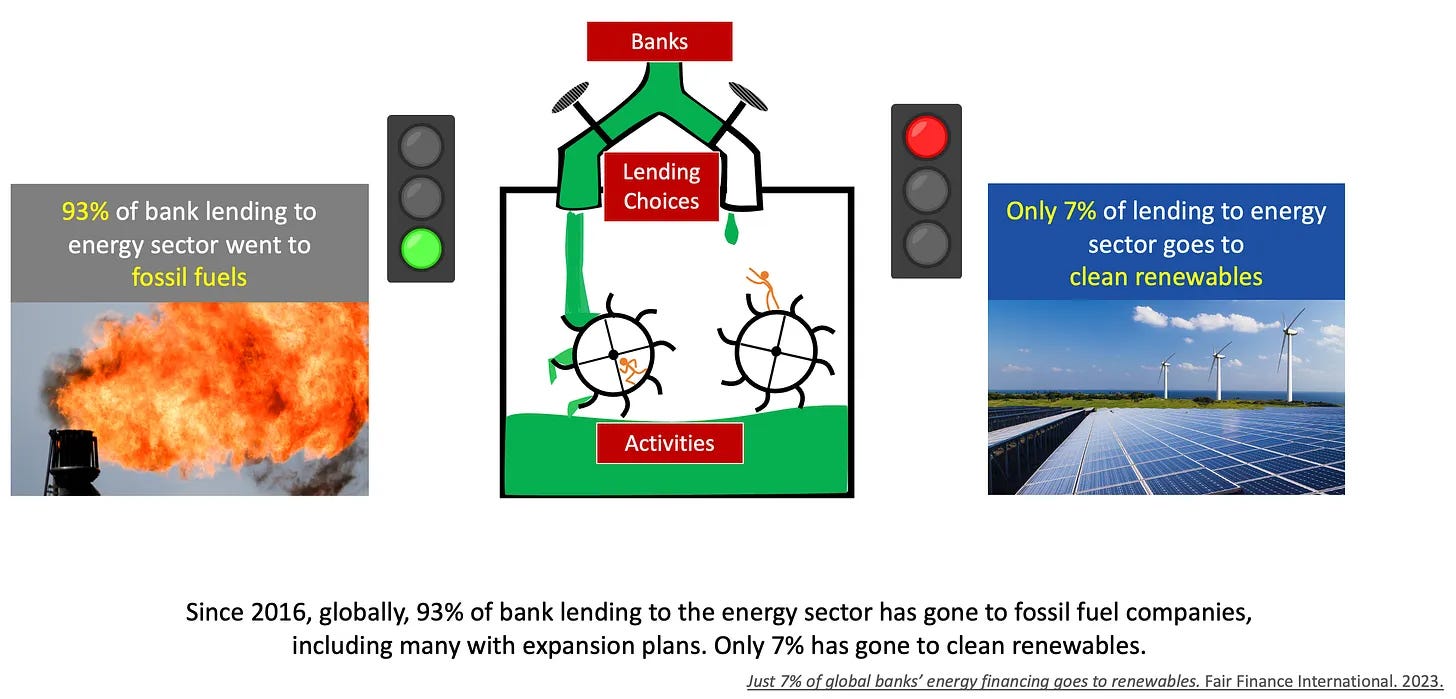
Taken together these decisions powerfully shapes our economies, economically and physically. Because it is more profitable for banks to lend to fossil fuel companies than renewable energy companies, we get economies evermore locked into fossil fuel infrastructure and production. Because it is more profitable to lend to luxury housing developers than affordable housing projects, most of the housing that gets built is above-market-rate, meaning it drives up the average price of housing. Because new land development is more profitable for banks than investing in urban amenities, we get racialized suburban sprawl.2
Pervasive influence
The influence over the economy that banks hold by virtue of having the privilege to create money isn’t limited to the moments when they approve or disapprove a loan application. It is much more omnipresent than that because most businesses, households, and governments are repeat bank borrowers and maintain long-term relationships with their bank creditors. In fact, as seen above, the largest share of bank money creation goes to short-term borrowers, meaning that large numbers of borrowers are re-upping their borrowing all the time (e.g., credit cards, inventory lines of credit, etc).
Corporations
In most countries, the banking sector provides 60-80% of all corporate debt financing, all through money creation. Bank loan portfolio managers weigh in on their corporate borrowers’ business plans, and when corporations shift plans they are careful to run them by their bank.
Households
Banks are also the main source of financing for households in Europe and most other countries aside from the US, where nonbank mortgage originators have overtaken banks. Householders worry year-round about maintaining good credit ratings so they will be able to get a bank loan for a house or car or obtain a credit card with a lower interest rate.
Governments
When governments sell bonds to raise funds, banks underwrite them and often hold significant quantities of government bonds themselves. One study in the US found that municipal bond holders (with banks making up 60%) significantly influenced the ways in which cities developed, often to the detriment of workers, women, and people of color. Governments were compliant due to their need to be able to borrow again in the future.
The point here isn’t that banks are evil or that it is unreasonable for banks to take measures to ensure corporations, households, and governments can repay their loans. It is that banks are only in this position of having such pervasive influence because they hold the legal privilege to create money and our economies are utterly dependent on their exercising it, in massive quantities.
Who’s responsible for this?
It’s important to remember that it is our governments that have given banks this power to be the deciders green lighting and red lighting what receives investment through money creation. National monetary systems are legal constructs established by laws and regulated by government institutions. There is nothing inevitable about how they function. The political calculus that resulted in the delegation of money creation to private for profit banks can be reconsidered. The goals of our national monetary systems can be realigned with the public interest, as they have been many times before.
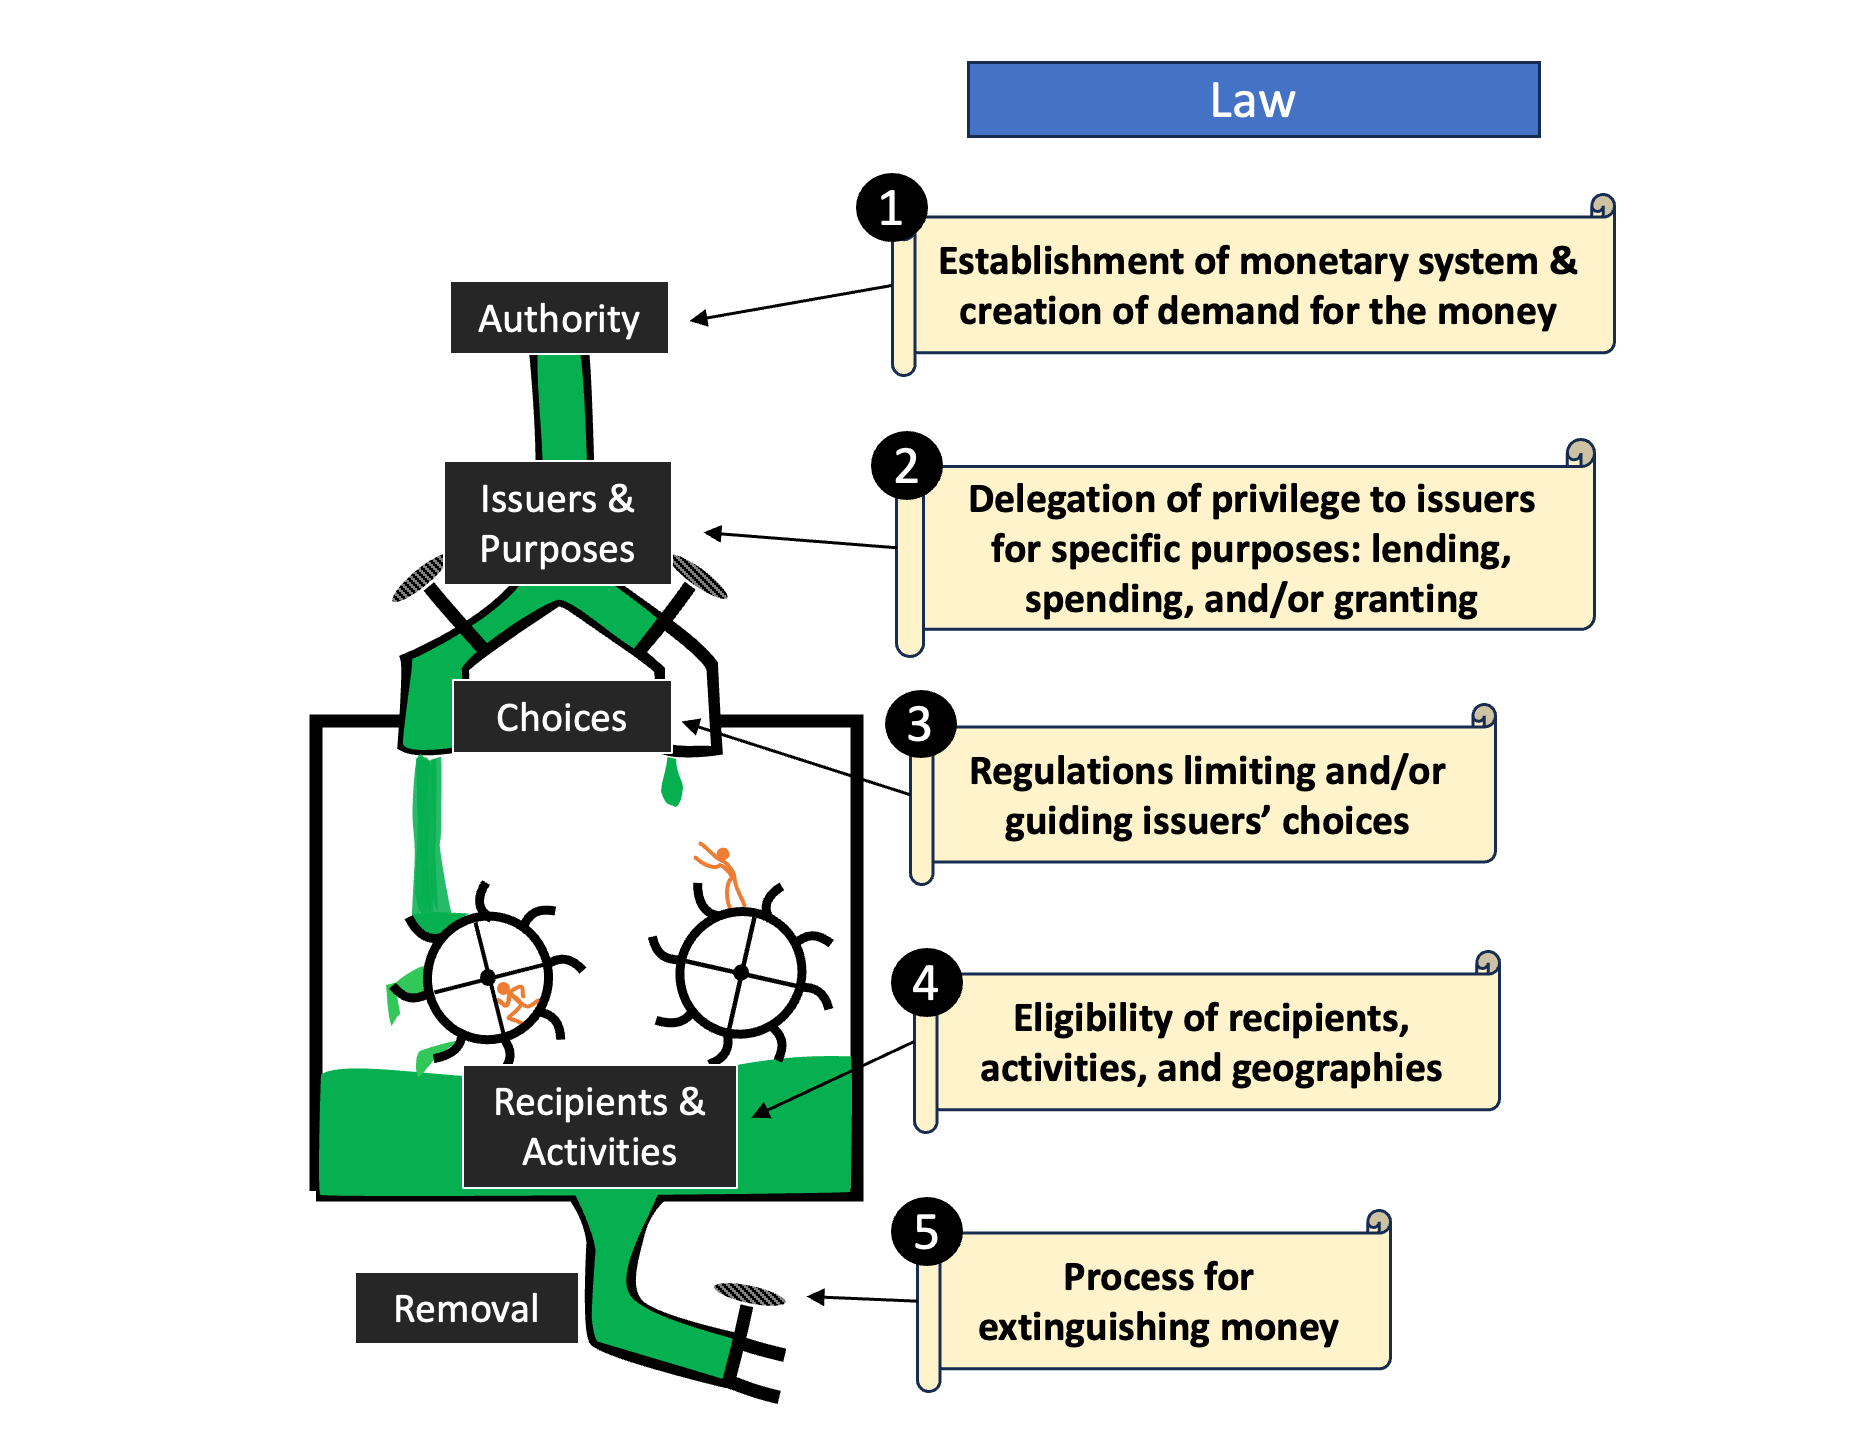
By challenge our governments’ decision to channel money creation through the profit motives of banks, we can change our economies to be more equitable and sustainable.
To put such large numbers into perspective, it can be helpful to break them down into more comprehensible chunks. Consider this: If you spent $1 million per day for the next 2,500 years, you will not have spent $1 trillion. A that rate, it would take 52,000 years to spend $21 trillion, the average amount that US banks created and deleted annually between 2016-2019. We’re talking about the creation and deletion of a lot of purchasing power every year.
Read Destin Jenkin’s Bonds of Inequality while keeping in mind that in the era he describes, banks were the largest buyers and holders of municipal bonds.
Excellent, Sam! I have often said that "in our debt money system, when loan payments (money deleted) exceed loans being made (money created), we get a recession due to lack of money and also that hoarding or just a slowing of bank lending can do that too.” Your article provides the exact mathematical proof for my intuition and the empirical evidence that the gross numbers are massive enough to make that mechanism extremely powerful.
Sam, thanks for your hard work, persistence, and for writing about this so clearly that most people can understand it. This is a great service to the health of the planet, and our collective and personal well being.